
Building the Income Statement
The income statement, also called the profit-and-loss (P&L) statement, shows the underlying profitability of the company — in other words, exactly how much money the business is making. This information is useful for the purposes of cal- culating taxes; it also helps the owner or manager run the business. Of all the three statements that make up the financial statements, the income statement is the simplest to understand because it simply shows the revenue earned by the business and the operating costs associated with generating that revenue for the business.
The income statement is usually more detailed than the other statements, so when building a financial model from scratch, you’ll normally tackle this one first.

 One of the things that differentiates the income statement from the other finan- cial statements is that each column refers to only one period. Most income state- ments are built on a monthly basis; some are also annual. With a cash flow or a balance sheet, you need to carry over the amount from the previous period, but with an income statement, each period starts fresh.
An income statement can also be used as a tool to compare current performance with past months or years, tracking the performance of the business, and provid- ing a basis from which to create a forecast or budget. The model you’re building is for the purpose of budgeting the projected income for the business over the next 12 months for the bank, and the income statement is a critical component.
All income statements follow a similar format:
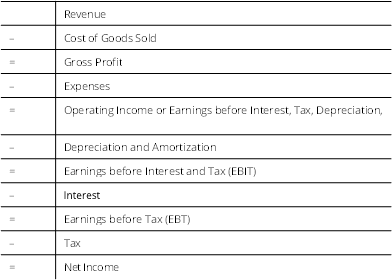
 You don’t need to be an accountant to build a financial model, but you do need to be familiar with basic accounting concepts, and the format of an income state- ment is about as fundamental as it comes. If you don’t lay out an income state- ment in this order, your model will lose all credibility.
Most of these line items you’ll find in the income statement for the financial model you’re building in this chapter, but cost of goods sold is not relevant for a business like yours, so it isn’t shown on your income statement. Some income statements may differ between companies and not show every single line item. For example, EBT is sometimes not shown, and the income statement jumps directly from EBIT to net income, without showing the earnings before tax has been applied.
Operating income or EBITDA is useful for knowing what the underlying profit- ability of the company is before you deduct tax, interest, depreciation, and amor- tization. EBITDA is sometimes used for company valuations because it gives managers, shareholders, and other interested parties a better indication of how the company is doing before other elements relating to the capital structure of the company come into play. Similarly, EBIT takes into account the depreciation and amortization but does not include interest and tax. Some managers’ key perfor- mance indicators (KPIs) and other targets are set based on EBIT or EBITDA because these items cannot be controlled easily by management.

Now that you know the basics of an income statement, you need to build one! For simplicity’s sake, the income statement will go on the same worksheet as the cash flow: the IS Cash Flow worksheet.
If you’ve been following along with this chapter from the beginning, you’ve already projected most of the income statement line items. The first part of the income statement simply requires you to “pull through” the revenue and expense summary lines by linking them to the Revenue and Expenses worksheets. Follow these steps:
-
Go to the IS Cash Flow worksheet, select cell C5, and enter the formula
=Revenue!B15.
This links cell C5 to cell B15 on the Revenue worksheet. The calculated result is $7,814.
-
Copy this formula across the row to calculate this for the entire year.
-
Select cell C7 and enter the formula =Expenses!D7.
This links cell C7 to cell D7 on the Expenses worksheet. The calculated result is $5,208.
-
Copy this formula across the row to calculate this for the entire year.
-
Select cell C8 and enter the formula =Expenses!D12.
This links it to cell D12 on the Expenses worksheet. The calculated result is $2,250.
- Copy this formula across the row to calculate this for the entire year.
- Calculate the sum total in cell C9 with the formula =SUM(C7:C8) and copy it all the way across the row.
-
In cell C11, calculate the EBITDA by deducting the expenses from the revenue with the formula =C5-C9.
The calculated result is $356.
- Copy this formula across the row to calculate this for the entire year.
-
Select cell C13 and enter the formula =Expenses!D22.
This links cell C13 to cell D22 on the Expenses worksheet where you calculated the depreciation earlier. The calculated result is $569.
- Copy this formula across the row to calculate this for the entire year.
-
In cell C14, calculate the EBIT by deducting the depreciation and amorti- zation from the EBITDA with the formula =C11-C13.
When the depreciation and amortization have been deducted, the cafe is making a loss for the fi month. The calculated result is –$214.
-
Copy this formula across the row to calculate this for the entire year.
The bank loan you’re applying for carries a 7 percent annual interest rate that you’ll pay monthly. In order to calculate the interest payable, you need to pick up the loan amount from the Balance Sheet worksheet and the interest amount from the Assumptions worksheet.
-
Still on the IS Cash Flow worksheet, select cell C16 and link it to the Balance worksheet tab by typing =, selecting the amount of the loan in cell K3, and pressing F4 to lock the reference. Then multiply it by the interest rate in cell B26 on the Assumptions worksheet, and lock the reference by pressing F4.
The formula is = ‘Balance Sheet’!$K$3*Assumptions!$B$26/12 and the calculated result is $175.
This formula multiplies the borrowed amount in cell K3 on the Balance Sheet worksheet by the annual interest amount in cell B26 on the Assumptions worksheet and divides it by 12 to convert it to a monthly amount.
The formula calculated result is $175.
-
Copy this formula across the row to calculate this for the entire year.
To calculate your tax expense, you need to multiply your EBT by your tax rate
of 30 percent.
- Select cell C19 and link this to the EBT by entering the formula
=C17*Assumptions!$B$27.
-
Press F4 to lock the reference.
The calculated result is –$117.

 Notice that the tax is a negative value, which forms a tax credit. When a business reports a negative net income, also called a net loss, these losses are tax deductible, and the business benefi from a tax benefi when this happens. Although the business won’t realize the credit right away because tax is not paid every month, you still need to show the calculated tax amount each month in order to derive an accurate profi amount.
 -
Copy this formula across the row to calculate this for the entire year.
You may need to adjust the decimal formatting.
-
In row 20, enter the formula =C17-C19.
This formula calculates the net income by deducting the tax from the EBT. The calculated result is –$272.
 Be sure to get your plus and minus signs around the right way! Mixing up the positives and negatives is the most common error on a fi statement.
Go over the logic of your income statement carefully, and make sure the tax is either positive or negative, depending on whether you’ve made a profi or a loss.
-
Select cell O5 and press Alt+=.
This automatically sums up the entire year with the formula =SUM(C5:N5). The calculated total is $111,755.
 Copy this down the column to row 20 to add up the totals for each line.
 By simply copying and pasting the formula down the column, it will copy the cell format as well as the formulas. Use Paste Formulas to copy only the formulas, and leave the formatting as it is.
To use Paste Formulas:
- Copy cell O5 onto the clipboard and press Ctrl+C.
- Highlight cells O5:O20 with the mouse.
- Right-click with the mouse, and select the Paste Formulas icon under Paste Options.
- Copy cell O5 onto the clipboard and press Ctrl+C.
-
Look down the column and remove the unnecessary zero values in rows 6, 10, 12, 15, and 18. Select these cells and press Delete.
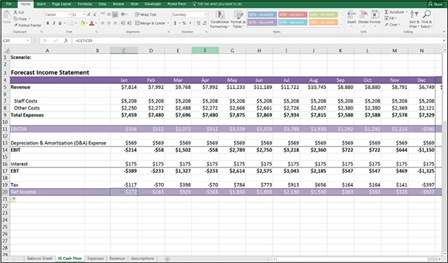
You’ve just completed the income statement — your fi fi statement for the business! Check your totals against Figure 10-8.
FIGURE 10-8:
The completed
income
statement.


