
Ten Strategies for Reducing Error

your financial models.
 The most common errors in financial models are silly formula mistakes — for example, picking up the wrong cell or missing a dollar sign in the cell referencing. Because these mistakes are the easiest ones to make, they’re also the easiest to avoid.
After entering a formula in a cell, press the Enter key. Don’t just click somewhere else.
There are two reasons not to click somewhere else after entering a formula.
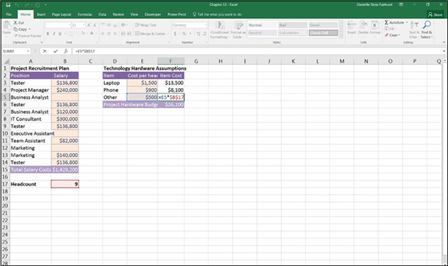
» You may accidentally pick up an incorrect cell, which then autocorrects to a completely incorrect formula, as shown in Figure 13-1.
» More important, when you click somewhere else after entering a formula, you’re not checking what you just entered. You need to be deliberate about what you’ve just done — don’t just quickly move on to the
next task. When you fi entering a formula, look at the result. Does it look right? Is the number what you expected?
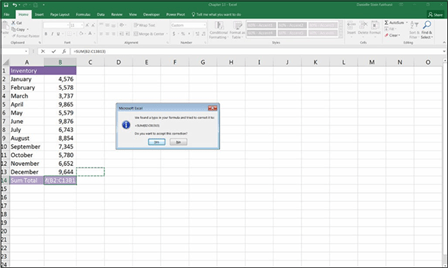 FIGURE 13-1:
If you click elsewhere after
entering a formula, you may accidentally pick up a cell you didn’t mean to
 pick up.
Pressing the Enter key is your number-one line of defense against errors.

Checking Your Work
A lot of modeling is trial and error. Making mistakes is okay — you just want to make sure you find your mistakes before someone else does! Silly formula mis- takes are the easiest ones to make — and the most embarrassing. Fortunately, by employing good error-checking techniques as you build the model, formula errors are the easiest ones to detect and correct.

 After you finish entering a formula, and after you’ve pressed the Enter key (see the preceding section), pause for a moment to check the result. Even if you’re in a hurry. Especially if you’re in a hurry. When you have to get a report out by the end of the day and the formulas are flying, that’s when mistakes happen. Use a calcu- lator or, if it’s a simple sum, highlight the range you’re adding, and check the total in the lower-right corner in the status bar, as shown in Figure 13-2. (The green triangle in the upper-left corner of cell B15 alerts you to the fact that some- thing isn’t quite right with this formula.)
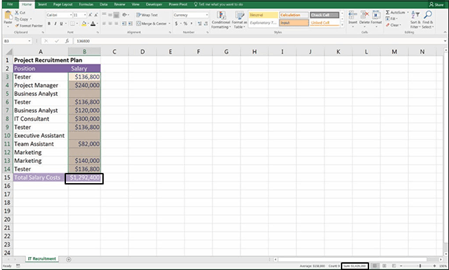 FIGURE 13-2:
Checking the sum total in the
status bar.
Highlighting cells and checking totals using this method is a good way of checking for errors. By checking your work as you build, you’re less likely to let errors slip through the cracks.
Checking It Again
After you’ve checked your formula and perhaps copied it down a block of calcula- tions, check it again! Another way to check the formula visually is to press the F2 shortcut key, which shows exactly which cells are being used in the formula (see Figure 13-3). This technique is most useful if the source cells are nearby and on the same sheet. When you’ve copied down all the cells in a block of data, do a spot-check with the F2 key to make sure it’s picking up the correct cells.
FIGURE 13-3:
Spot-check formulas using the F2 key.
Getting Someone Else to Check Your Work
Once you’ve entered the formulas, checked them, copied down the block, checked the totals, finished your model, and checked again, it’s time to have someone else look at it. I highly recommend having an agreement in place with one of your col- leagues where you check each other’s work before it gets sent to senior manage- ment. There’s no faster way to lose credibility than having your mistakes pointed out in public.
Why have someone else review your model? Because that other person will bring a fresh perspective. Sometimes you’ve looked at your model for so long that you just can’t see the glaring error right in front of you. Just explaining the model’s logic to someone else can also help you to see holes in the logic and ways to improve the methodology.
If the model is high profile or very important, you may want to get it audited by a model audit firm. Many organizations specialize in conducting professional model audits. This is really the only way to be absolutely confident that there are no errors and your model is working correctly.
Documenting Assumptions
A model is only as good as the accuracy of the assumptions. The phrase “garbage in, garbage out” has never been more relevant than in the context of financial
modeling. Even the most beautifully built, best-designed model will be completely worthless if the input assumptions that go into it are incorrect.
Important decisions are made based on the outputs of the model, so it’s absolutely critical to list clearly (and sometimes in mind-numbing detail) the assumptions that have gone into the model.

 Models are only as good as the data they contain, and the answer they produce should most certainly not be taken at face value. When presented with a model, a smart manager or decision maker will query all the assumptions and the way it’s built.
As a financial modeler, you must ensure that all the assumptions have been vali- dated to the best of your ability. Document clearly where the numbers came from so that there can be no possible misinterpretation of the assumptions you’ve used. That way, the assumptions can be revisited and possibly revised at a later date.
Documenting Methodology with a Flowchart
When you’re explaining a complex process, such as one represented by your financial model, it can sometimes help to have a diagrammatic flowchart that explains the way that the numbers have been calculated in your model.
Excel doesn’t create a flowchart of the model very easily, although there are add- ins that can help you do this. Without the help of add-ins, you can use SmartArt or simply cells and arrows to create a flowchart to document the inflows and out- flows of your data within the model.
A flowchart isn’t always necessary, but if your model contains a large number of sheets and calculations and is difficult for others to follow, a flowchart can be helpful for checking the logic. It’s also useful in explaining the methodology of your model to other people.


