
Building a Discounted Cash Flow Valuation

In fact, many other methods of valuation — such as cash flow multiples and the leveraged buyout model — are proxies or derivatives of the DCF model. Normally, modelers use the DCF when trying to decide what the value of an asset is. For example, you may be considering purchasing a company or a large piece of equipment and want to know what the value of the asset is for you.
DCF calculations are normally an add-on to an existing, working financial model, but in order to use the DCF method to arrive at a value for the asset, you need to make sure that the model contains the following three pieces of information:
» Free cash fl to the fi or the information necessary to calculate this
» Weighted average cost of capital
» Perpetuity growth rate (an assumption)
In this chapter, I explain how to pull out the pieces of information you need in order to calculate value using the DCF method. Of course, before you do so, you
need to make sure that you have all the necessary inputs. If you didn’t build the financial model that contains the information you’ll be using, make sure that you understand the information you’ve been given and that the financial model is cor- rect. For more information, see Chapter 5.
Understanding How the Discounted Cash Flow Valuation Works
The core concept of the DCF is that of the basic finance concept of the time value of money, which states that money is worth more in the present than the same amount in the future. In other words, a dollar today is worth more than a dollar tomorrow.
The idea behind the time value of money is that if you have to wait to receive your funds, you’re missing out on other potential investment opportunities, not to mention the risk of not receiving the money at all. If you have to wait to get your money, you’d expect some compensation — hence, the concept of interest. For example, if you invest $100 at a 10 percent annual interest rate today, it will be worth $110 in one year. Conversely, $110 in one year would only be worth $100 today. In this example, the 10 percent is referred to as the discount rate. As the name suggests, the discount rate is a key input you need to calculate the DCF.
 A DCF valuation uses a modeler’s projections of future cash flow for a business, project, or asset and discounts this cash flow by the discount rate to find what it’s worth today. This amount is called the present value (PV). Excel has a built-in function that automatically calculates PV.
 If you want to know the math behind the function, here’s how to calculate PV, where CF is the cash flow for the projected year, r is the discount rate, and n is the number of years in the future:


 PV CF1
CF2
CF3
CFn


 1 r 1 r
1 r 3 1 r


 In the case of a project or asset with finite cash flows, the modeler would forecast all the cash flows and discount them to find the present value. For example, if you were purchasing an asset such as a large piece of machinery that has an expected life of ten years, you would model the entire ten years. When purchasing a busi- ness, however, which is expected to be a going concern and the cash flows are expected to continue into perpetuity, a DCF analysis must find a terminal value at the end of a certain forecast period instead of forecasting cash flows into eternity.
The terminal value represents the projected value of the company or asset at the end of the forecast period. Forecast periods are typically projected to the point at which cash flows are expected to grow at a stable and predictable rate. When the cash flows become stable, you can then reasonably estimate a fair value for the steady cash flows that are earned after that point in time.
There are variations of the DCF analysis in which the cash flows, discount rates, and terminal values can differ, but the most common method is to project free cash flow to firm, find a terminal value using the perpetuity growth method, and discount these values by the business’s weighted average cost of capital.
For the case study in this chapter, assume that you’ve been provided with the projected financial model containing the financial statements for a company. It’s your responsibility to perform a DCF analysis to arrive at a valuation for the busi- ness and ultimately a fair value for its equity shares.
Download the file File 1101.xlsx from www.dummies.com/go/financialmodeling
inexcelfd, open it, and spend a few minutes reviewing and familiarizing yourself with the financial statements. If you’ve completed the case study in Chapter 10, you’ll recognize these financials. In Chapter 10, you build a financial model con- taining a full set of integrated financial statements, covering a 12-month period. To perform a DCF analysis, however, you need several years of financial state- ments, which are provided in this new model.
Step 1: Calculating Free Cash Flow to Firm
The DCF will discount projected free cash flow that the business will earn, also called the free cash flow to firm (FCFF). A business’s FCFF represents the cash flows the business will earn, disregarding cash flows associated with the capital struc- ture, such as interest expense, debt paydown, dividends, or capital raises. The DCF yields the value of the whole business.
The financial model provided in File 1101.xlsx has a projection period of seven years for the business and includes the Income Statement, Cash Flow Statement, and Balance Sheet for this period. Your job is to calculate the projected FCFF and then use this to calculate the DCF.

 There are different variations of the DCF that may use a different FCFF to discount. For instance, a levered free cash flow DCF may project a future capital structure for the business and project a free cash flow to equity (FCFE), which accounts for costs of financing like debt interest and paydown. In this chapter, I explain the more common method of discounting FCFF.
Although there are different ways to arrive at FCFF, a common equation derived from net income is the following:
Free Cash Flow to Firm = Net Income + Depreciation and Amortization and Other Noncash Charges + Interest * (1 – tax rate) – Capital Expenditures + Change in Working Capital
To calculate FCFF, follow these steps:
-
Add depreciation and amortization and other noncash charges to the net income.
These noncash expenses do not represent actual cash outfl from the business. Depreciation and amortization is the most common noncash expense to add back, but all other noncash expenses found in the income statement should be added back as well.
-
Add the interest expense to the number you arrived at in Step 1.
You add back the interest because you have to disregard the charges associ- ated with the capital structure and debt. Because interest expense is tax- deductible on the income statement, you need to add back interest adjusted for the taxes saved by its deduction.
-
Subtract capital expenditures from the amount you arrived at in Step 2.
Capital expenditures and long-term investments are real cash outfl for the business that are required to keep the business going and properly invested in for the future.
-
Add the working capital to the amount you arrived at in Step 3.
Working capital is calculated by subtracting current liabilities from current assets and includes line items like inventory, accounts receivable, and accounts payable. These items are continually required on the balance sheet for the business to operate. If more working capital is required due to an inventory increase, this represents a cash outfl because the business will need to spend cash to purchase said inventory. Conversely, if less working capital is required due to an increase in accounts payable (the ability to pay vendors later), this represents a cash infl for the business.
Now that you know how to arrive at FCFF from net income, you need to link these projected line items from the included financial statements. On the DCF tab of the model you have open, you’ll find these labels in cells A14:A19. Follow these steps:
- Select cell C14 and link it to the Year 1 Net Income in the Income and Cash Flow tab using the formula =‘IS Cash Flow’!C27; copy this formula across the row.
- Select cell C15 and link it to the Year 1 Depreciation & Amortization in the Income and Cash Flow tab using the formula =‘IS Cash Flow’!C13; copy this formula across the row.
-
 Select cell C16 and link it to the Year 1 Interest and multiply it by (1 – Year 1 Tax Rate) in the Income and Cash Flow tab using the formula =‘IS Cash Flow’!C19*(1-‘IS Cash Flow’!C25); copy this formula across the row.
You’re adding back interest and tax-adjusting it to account for the tax savings of the expense.
 Select cell C17 and link it to the Year 1 Capital Expenditures in the Income and Cash Flow tab using the formula =‘IS Cash Flow’!C45; copy this formula across the row.
- Select cell C18 and sum all Year 1 Working Capital cash fl in the Income and Cash Flow tab, including increases in inventory, accounts receivable, and accounts payable using the formula =SUM(‘IS Cash Flow’!C38:C40); copy this formula across the row.
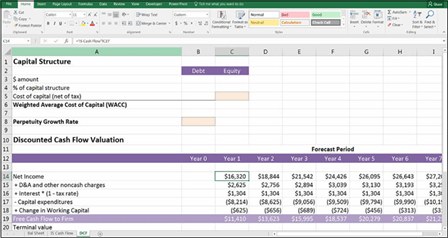
- Select cell C19 and sum all these cash fl adjustments including Net Income, D&A, Interest, Capital Expenditures, and Changes in Working Capital to arrive at FCFF using the formula =SUM(C14:C18); copy this formula across the row.
You’ve just completed the FCFF calculation, your first step in the DCF analysis. Check your totals against Figure 11-1.
FIGURE 11-1:
Calculating FCFF.
Step 2: Calculating Weighted Average Cost of Capital
The most common discount rate used for a FCFF DCF is the company’s weighted average cost of capital (WACC), which is the company’s cost of capital weighted by how much debt and equity it has:
WACC = (Proportion of Equity × Cost of Equity) + (Proportion of Debt × Cost of Debt, Less Tax)
The cost of equity, or the return required by the market in exchange for owning the company’s equity, is multiplied by the percentage of the business’s capital struc- ture that is equity. The cost of debt, or the interest required by lenders in exchange for lending money to the company, is similarly multiplied by the percentage of the business’s capital structure that is debt. The cost of debt is also multiplied by 1 minus the tax rate because interest is tax-deductible, which effectively lowers the cost of having debt by the amount of tax savings.
In this case study, you have a capital structure made up of 45 percent debt and 55 percent equity. You need to multiply each of these by the cost of equity and the market rate of the debt to come up with the WACC for the company. Follow these steps:
-
Select cell B3 and link it to the Year 1 amount of Long-Term Debt of
$30,000 in the Balance Sheet tab using the formula =‘Bal Sheet’!$C$28.
- Select cell C3 and link it to the Year 1 amount of Equity of $36,320 using the formula =‘Bal Sheet’!$C$34.
-
Select cell B4 and divide the amount of debt by the sum of debt and equity and lock the reference in the divisor, with the formula =B3/ SUM($B$3:$C$3); copy the formula across to cell C4.
Now you have the percentage of the capital structure that is debt and equity.
Assume that the Year 1 capital structure is the current optimal long-term mix of debt and equity for the business. Because capital structures constantly change, when you build your own fi model you’ll want to consider the optimal or most common long-term capital structure for the business under the current conditions.
To arrive at your cost of debt, you must take your interest expense and multiply it by 1 minus the tax rate to adjust for the tax deductibility of interest.
-
Select cell B5, link it to Year 1 interest, and multiply the interest by
(1 – Year 1 Tax Rate) in the Income and Cash Flow tab using the formula
=‘IS Cash Flow’!C20*(1-‘IS Cash Flow’!B25).
You have determined that investors in this business and similar small busi- nesses require a 15 percent return to own the equity.
- In cell C5, enter 15% as a hard-coded input value.
-
Select cell B6 and multiply the cost of capital for debt and equity by their respective percent of the capital structure and add them together to fi the business’s WACC with the formula =B4*B5+C4*C5.
The calculated value is 10.2 percent. Check your totals against Figure 11-2.
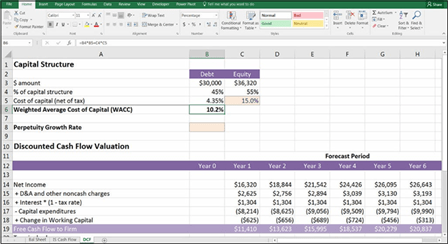 FIGURE 11-2:
Calculating the WACC.


