
Macro 100: Sending All Excel Charts to a PowerPoint Presentation
It’s not uncommon to see multiple charts on one worksheet. Many of us occasionally need to copy our charts to PowerPoint presentations. The macro here assists in that task, effectively automating the process of copying each one of these charts into its own slide.
How it works
In this macro, we loop through the ActiveSheet.ChartObjects collection to copy each chart as a picture into its own page in a newly created PowerPoint presentation.
Keep in mind that because this code will be run from Excel, you need to set a reference to the Microsoft PowerPoint Object Library. Again, you can set the reference by opening the Visual Basic
Editor in Excel and selecting Tools➜References. Scroll down until you find the entry Microsoft
PowerPoint XX Object Library, where the XX is your version of PowerPoint. Select the check box next to the entry.
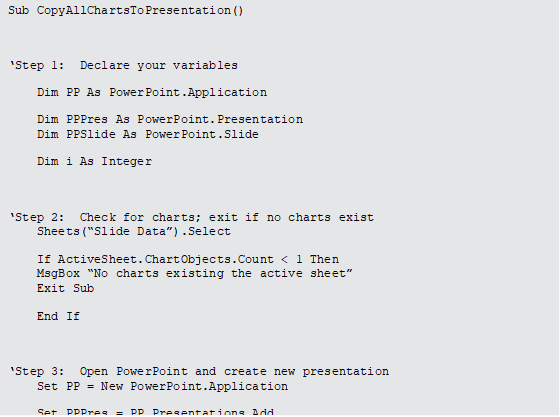
- Step 1 declares four variables: PP is an object variable that exposes the PowerPoint Application object; PPPres is an object variable that exposes the PowerPoint Presentation object; PPSlide is an object variable that exposes the PowerPoint Slide object; and i is used as a counter to help loop through the charts in the worksheet.
- Step 2 does an administrative check to ensure that there are actually charts in the specified worksheet. If no charts are found, the macro exits the procedure with no further action.
- Step 3 opens PowerPoint with an empty presentation. Note that we are setting the Visible property of the PowerPoint application to True. This ensures that we can see the action as the code runs.
-
Step 4 establishes how many times the macro will go through the procedure by capturing the number of charts in the worksheet. In other words, if the worksheet contains
five charts, the code will loop five times. The macro starts the loop with one and keeps loop- ing through the procedure until we hit the number of charts in the worksheet. The variable i ultimately represents the chart number we are currently on.
-
Step 5 uses the CopyPicture method to copy the chart as a picture. The variable i passes the actual chart number we are currently working with. The Application.Wait method tells the macro to pause for a second, allowing the clipboard to catch up with all the copying going on.
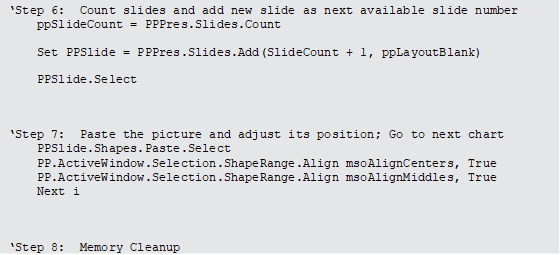
- Step 6 adds a new slide to the presentation using the Add method of the Slide object. Note that we are using SlideCount+1 to specify the index number of the added slide. Because we are looping through an unknown number of charts, we can’t hard-code the index number for each slide. Using SlideCount+1 allows us to dynamically assign the next available number as the slide index. Note that in Step 6, we are using ppLayout Blank, ensuring that the newly created slides start with a blank layout. The macro then takes an extra step here and actually sets focus on the slide. In other words, the code explic- itly tells PowerPoint to select this slide, making it active.
- Step 7 pastes the picture into the active slide, centers the picture both horizontally and verti- cally, and then moves to the next chart.
- Step 8 releases the objects assigned to your variables, reducing the chance of any problems caused by rouge objects that may remain open in memory.
How to use it
To implement this macro, you can copy and paste it into a standard module:
- Activate the Visual Basic Editor by pressing ALT+F11.
- Right-click the project/workbook name in the Project window.
- Choose Insert➜Module.
- Type or paste the code.


