FINDING AN RGB COLOR
If you don’t know the RGB color that’s been used in your company logo or the image you’d like to insert in the model, you can easily fi the color code by following these steps:
-
Open the image in Microsoft Paint, and click the color with the color picker.
You can fi the color picker in the Tools section of the Home tab.
-
Click Edit Colors on the right side of the Home tab.
The amount of red, green, and blue (RGB) is shown. In the example shown here, I clicked one of the purple circles of my logo, which gave the exact RGB color code that the designer originally used to create the logo (Red = 80, Green = 32, Blue =70).
When you have the RGB color, you can use the color in your Excel model.
- Highlight the cells you want to change.
- On the Home tab of the Ribbon, click the arrow next to the Fill Color button in the Font section.
-
Select More Colors at the bottom.
The Color dialog box appears.


Gathering Data to Put in Your Model
A financial model is only as good as its inputs or source data, and a large part of the modeler’s job is often collecting, interpreting, analyzing, and even manipulating or extrapolating the data to go into the model. In many cases, as much time can be spent collecting data as is spent actually building the model, so if you can collect the data in the correct format in the first place, this could save you a lot of time.

 You often have to obtain data you need to build the model from other people or external sources, which can be a frustrating and time-consuming process. Here are some guidelines that can make the data-gathering process easier:
 » Let other parties know well in advance what information you need and
its purpose.
» Give them a due date that is realistic for them and fi your time frame.
» Design the input sheets in your model so that the data can be pasted directly in.

 » Use dummy data in the meantime if you need to so that you can continue
building the model while waiting for the information to come in.
» Allow enough time to check the quality and reliability of the information that
has been submitted.
» Make sure people know what you expect in terms of data quality. Does it need to be 100 percent accurate or is an estimate okay? Normally, model input data is simply taken at face value, and the source is documented in the assump-
tions. If an estimate is used, be sure to document it as such.
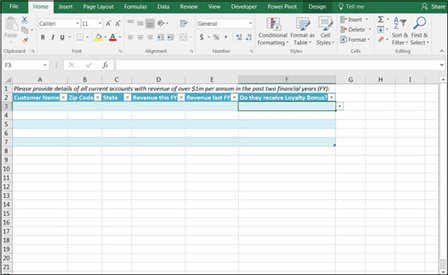
» Be specifi about what format you need the data in. Giving them a template to complete can prevent misunderstandings. For example, instead of a request like “Please provide information on key customer accounts,” which might yield
a list of 500 customers and their addresses, a template like the one shown in Figure 3-7 would give better results.

 Consider using protection to prevent incorrect entry, such as restricting inputs to either a “yes” or a “no,” as shown in column F of Figure 3-7. For instructions on how to use data validations, see the section on “Restricting user data entry” in Chapter 6. If you’d like to try this out for yourself, you can download File 0301.xlsx from www.dummies.com/go/financialmodelinginexcelfd. Open it and select the tab labeled 3-7.
 FIGURE 3-7:
Information
request template.
Documenting the Limitations
 of Your Model
If other people are going to be using your model, be sure to explain the assump- tions you made in building the model, especially if the person who is going to be using your model is not an experienced modeler. Users tend to put blind faith in the outcome of the model, which can be dangerous. Instead of taking the model results as gospel, the user should simply use them as a guide.

 Models are only a construct that reflects reality; they are not reality. You can make this clear to users of the model by using language such as “Based on our forecasts . . .” or “Assuming trends continue. . . .”
In the example of the decision analysis model for the bus company case study (see the section “Identifying the Problem That Your Financial Model Needs to Solve,” earlier in this chapter), the builder of this model might say, “We’re going to lose half of our profit over the next 12 months,” which is not incorrect, but it would be more accurate to say, “Based on current forecasts, we’re going to lose half of our profit over the next 12 months unless we take action” and then show
the inputs and assumptions used. For example, the modeler is assuming the following:
 » Five hundred tickets will be sold in the fi month of operation.
» Ticket sales will increase by 1.5 percent per month after the first month.
» There is no cannibalization between the routes. Often, when launching a new product, some existing customers switch to the new product. Seeing as the new route is servicing a new area, the modeler doesn’t expect any
cannibalization and hasn’t included it in this model.


