
Getting Acquaintedwith Excel

eling, I’m going to introduce you to the tool you’ll be using, Microsoft Excel.
Almost every financial model you’ll come across will make use of Excel to some extent, but alternatives to Excel do exist, as do add-ins to improve Excel, both of which I cover in this chapter. Finally, I look at some of the issues and risks related to the use of Excel, just so you know what to expect.

Making Sense of the Diff Versions of Excel
Every few years, Microsoft brings out a new version of Excel. For users who are comfortable with the way their version of Excel works, these changes are often met with apprehension or dismay. But for avid Excel fans like me, each new release is a cause for excitement! I’m always eager to find out what new tools and
features have been introduced to improve the process of building financial models in Excel.
Although major changes have been applied to Excel over the past few versions, the changes are less relevant for financial modelers than they are for some other folks. Why? Because many of the new features are visual, and financial modeling relies less on visual features and more on links and formulas, which haven’t changed.
 Some new functions have been introduced in recent versions of Excel. If you build a model that contains these new functions and a user opens it in a previous ver- sion of Excel, he’ll get a #N/A error. I recommend avoiding new functions when you’re building a financial model, unless you’re sure that anyone who needs to use your model will be using the same version of Excel as you.
 If you’re not sure whether you’ve used any functions or features not available in previous versions of Excel, use the Inspect Workbook tool (see Chapter 5) to fi out.
 And if you’re not sure which version of Excel you’re using, open Excel and choose File ➪
Account ➪
About Excel. At the top of the dialog box that appears, you’ll see the version number. If that doesn’t work, then you’re probably using a very old version; choose Help ➪
Resources ➪
About.
A rundown of recent Excel versions
In this section, I walk you through some of the features introduced in recent ver- sions of Excel. Although these lists are not exhaustive, they are the features you’re most likely to use for the purposes of financial modeling and analysis.

 If you have Excel on an Office 365 subscription plan, you get new features as soon as they roll out with each update, instead of having to wait for the next version of Excel.
Microsoft Excel 2016
In Excel 2016, the following features were added:
 » The Tell Me What You Want to Do box was added to the Ribbon. This box is
a very user-friendly way of fi your way around Excel.
» The following new charts were added: Waterfall, Treemap, Sunburst, Histogram, Box & Whisker, and Funnel. These new charts are a welcome addition to Excel and make it very easy to display the results of your fi
model. But remember that if you insert any of these new charts into your
 model and a user opens it in a previous version of Excel, the charts won’t be available — they’ll only be able to see a blank white box.
» Power Query was changed to Get & Transform. It’s on the Data tab on the Ribbon. In prior versions of Excel, Power Query had to be installed as a free downloadable add-in, but Get & Transform comes standard.
» Forecast Sheet was added. It’s a very powerful way of forecasting using historical data.
» The following new functions were introduced. Note these functions are only available in Excel 2016 to Offi 365 subscribers:
-
TEXTJOIN: Use this function to link the text in ranges of cells together. This is one of my favorite new functions because you can now string entire
ranges of cells together, instead of linking them individually as you had to do with the ampersand (&) or the CONCATENATE function.
-
CONCAT: Use this function to link the text in individual cells together. This was called CONCATENATE in previous versions. You can also use the
ampersand (&) instead of CONCAT or CONCATENATE.
- IFS: Use this function if you have multiple conditions to include in a single cell. This function makes using a nested IF function much easier.
- SWITCH: Use this function to look up a list of values and return a matching result in a single cell.
- MAXIFS: Use this function to calculate the maximum value that meets specifi criteria.
 MINIFS: Use this function to calculate the minimum value that meets specifi criteria.
Even though these new functions might come in handy, they won’t work properly if the person opening your model is not using Excel 2016 or later.

Microsoft Excel 2013
In Excel 2013, the following features were added:
 » Flash Fill was introduced. Flash Fill is a handy tool that picks up on the pattern of what you’ve entered.
To use Flash Fill, start typing an abbreviated version of your data in the column directly next to it, as shown in Figure 2-1. Based on the pattern of what you’ve typed, a grayed-out version of suggested text is displayed. Press Enter to accept this data. If you’d like to try this out for yourself, you can download File 0201.xlsx from www.dummies.com/go/financialmodelinginexcelfd. Open it and select the tab labeled 2-1.
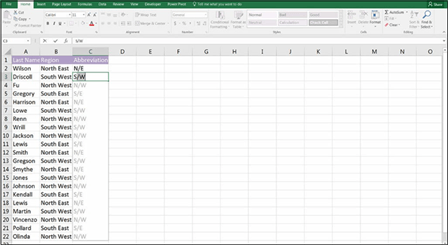 FIGURE 2-1:
Flash Fill.
 » The Combo Chart was introduced as a standard chart. Combo Charts display a line chart and a bar chart on two diff axes. For example, you might choose to show customer numbers on one axis and profi on the other,
as shown in Figure 2-2.
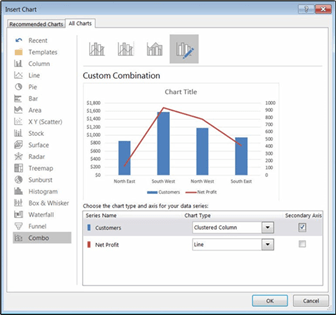 FIGURE 2-2:
Combo Chart.
 » Multiple monitors were made easier to work with because the interface changed so that you can have two separate fi open and view them side by
side. In the past, you would have had to open a completely new session of Excel to do this, so you couldn’t link between fi Whether you link between fi or not, having large and/or multiple monitors is defi recommended for large and complex models!
» Fifty new functions were introduced, enhancing the already abundant function set. Most of the new functions are used for statistics, trigonometry, and engineering, but here are a few that you might fi useful for fi
modeling:
- PDURATION: Use this function to return the number of investment periods required for the invested amount to get to the specifi value.
- IFNA: Use this function to suppress an #N/A error only.
-
ISFORMULA: Use this function to return the value TRUE if the cell contains a formula. This function is similar to the ISERROR, ISNUM, and ISTEXT
 functions.
Even though these functions might come in handy, they’ll return an error if the person opening your model is not using Excel 2013 or later.

Microsoft Excel 2010
At first glance, there were no obvious changes introduced in Excel 2010, but this upgrade was actually deceivingly radical because it was the first version to intro- duce the Power Suite of tools, now called Modern Excel. Additionally, two other features made an appearance for the first time:
 » Slicers: Slicers are a great way of fi PivotTables.
» Sparklines: Sparklines are tiny charts in a single cell. They’re a great way of displaying trends in a small space.
Figure 2-3 shows an example of a PivotTable with a slicer on the left in column A and a series of sparklines in column D. When you select one of the regions shown in the slicer, the data for the PivotTable filters to show only that selection. Addi- tionally, sparklines in column D show the trend over a 12-month period of that line item.
These two features, although not related, work together so that when Africa is selected, for example, the total profit and loss numbers for Africa show only in column C, and the 12-month trend for Africa in the sparklines show only in column D. Both slicers and sparklines were particularly useful additions for build- ing dashboards.
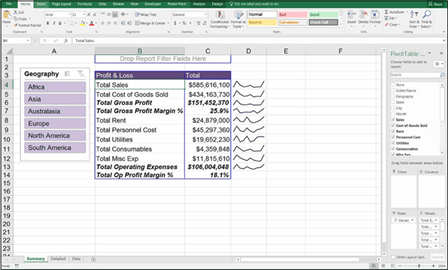 FIGURE 2-3:
Slicer and sparklines.
 The space in which slicers and sparklines are built will simply show as blank areas if the file is opened in Excel 2007 or earlier.
 Microsoft Excel Online
You can use Excel online through a web browser with Microsoft Excel Online. Microsoft Excel Online is completely free, works on any browser, and is useful for shared files and collaborating with others. It’s basically a stripped-down version of Excel.
 Microsoft Excel Online is only sufficient for a casual user of Excel, not for a finan- cial modeler. You need a desktop version of Excel in order to work through the steps in this book.
Focusing on fi formats
Another thing that you may need to consider when working with different ver- sions of Excel is the file type. Way back in Excel 2007, the file formats were changed from XLS to XLSX. The XLSX file format is more secure, faster, and more compact than XLS files. Also, XLS files are also limited to 65,000 rows, which sounds like a lot, but XLSX files can handle up to a million rows.
Although the XLSX file type has been around for many years, Excel files that have been downloaded from another system are sometimes automatically saved as XLS files. If you have Excel 2007 or later, you can save the file as XLSX by choosing File ➪
Save As, and changing the file type from Excel 97–2003 to Excel Workbook.
You might also run into the XLSM file format. Those files contain macros, which contain executable code. If you’re using macros, Excel will prompt you to save the file as XLSM. And if you accidently save a file with macros in it as XLSX, all the macros will completely disappear!

 The XLSB file format is a binary file format and is even more compressed than XLSX, making the file size even smaller (which means the files open and save much faster than other file types). It has the added advantage of supporting mac- ros. The only disadvantage is that XLSB files can’t be read by other databases and software, including other cloud-based spreadsheet programs (although that’s not usually an issue for financial models).
 You should always save your models as XLSX file types, or XLSB if file size becomes an issue.


Defi Modern Excel
Any version of Excel released from Excel 2010 onward is referred to as Modern Excel because it introduced the groundbreaking Power Suite, which consists of Power Pivot, Power Query (now called Get & Transform), and Power View (as well as Power Map and Power BI, which were added later). The introduction of these tools was the most exciting thing to happen in the Excel world since the PivotTable.
Table 2-1 offers a summary of the features of Modern Excel.
The self-service BI space, in particular, is growing rapidly, and there are many other pieces of software that can perform similar tasks. In my opinion, these Modern Excel tools are the way to go for handling and visualizing data for the fol- lowing reasons:
 » Low cost: Power BI Pro (with larger data capacity and enhanced sharing capabilities over standard Power BI) comes with a small monthly cost, but the other tools are included with your Excel license.
» Familiarity: Because they’re part of Excel, and mostly use the familiar Excel interface, existing Excel users can get the hang of it more quickly than completely new software — although Power Pivot can take some time to
fi out.
» Integration: It’s pretty easy to convince the boss to implement these tools because they’re already part of Excel.
TABLE 2-1 Modern Excel Tools
|
Tool |
What It Does |
Programming Language |
Relevant Version |
|
Power Pivot |
Pulls much larger quantities of data than could be handled in standard Excel from different sources and stores it in a highly compressed format. Users can create relationships, perform complex calculations, and display output from different tables into a single- view PivotTable. |
DAX |
First introduced as an add-in to Excel 2010; native to Excel 2016* |
|
Power |
Extracts data from various sources. |
M |
First introduced as an add-in |
|
Query |
The user can cleanse and format |
to Excel 2010; native to 2016* |
|
|
(Get & |
the data and save this procedure; |
(when the name changed to Get |
|
|
Transform) |
the procedure can then be |
& Transform) |
|
|
repeatedly performed each time |
|||
|
the data is refreshed. |
|||
|
Power View |
Enables animation of charts (for example, showing movement of bubble charts over time). |
None |
Excel 2013 and 2016 (disabled by default) |
|
Power Map |
Allows you to dump some data into a table, containing location names, postcodes, or map coordinates, and Power Map shows your data visually on a map. Very cool! |
None |
Excel 2013 and 2016* |
|
Power BI |
A cloud-based, self-service analytics tool with which you can create dashboards, reports, and visualizations. |
None |
Desktop version fi made available in 2015. Note that Power BI is the only tool mentioned that does not sit within Excel. |
*To access these tools, you need Office Professional Plus 2013 or Office Professional 2016. They are not available in the Home & Student Edition.
Many financial modelers I know don’t see these new tools as being relevant to them. Sure, they are data analysis tools as opposed to modeling tools, but modelers spend a lot of time extracting, updating, and manipulating data. Power Query, in particular, is a useful tool for performing these tasks more quickly and efficiently.
The Modern Excel tool that is the most likely to be used for modeling is Power Pivot. As a self-service BI product, Power Pivot is intended to allow users with no specialized BI or analytics training to develop data models and calculations, shar- ing them either directly in Excel or through SharePoint document libraries. You should consider using Power Pivot for the data in your model if any of the follow- ing is true:
 » The data your model is using contains many thousands of rows and your model is starting to slow down, especially when you add formulas.
» You use PivotTables or tables extensively.
» Your data needs to be sourced from multiple locations.
The disadvantage of using Power Pivot is that, although you don’t need to be a BI specialist to view and edit reports, learning how to build models with Power Pivot is not particularly straightforward, even for advanced Excel users. You can get started on these tools with some free YouTube videos.
As a modeler, you’ll be using Excel all day every day, and you need to keep up to date with all the changes, including the new tools of Modern Excel, because Microsoft releases new updates regularly. Throughout this book, I recommend the use of these tools to access, retrieve, or update the data for your model, or to dis- play the outputs, but in terms of building your financial model, I’ll stick with plain vanilla Excel.
For more information on some of the tools in Modern Excel, check out Microsoft Excel Power Pivot & Power Query For Dummies by Michael Alexander (Wiley).


