
Bookmarks
Bookmarks is a powerful feature of Power BI that allows you to capture the state of a report page and save this state to be referred to at a later time. When creating a bookmark, the following elements are saved as part of the bookmark’s definition by default:
- The current page, along with all of the visuals on the page
- All filters, including the states of slicers and selections within visuals (such as cross- highlight filters)
- Sort the order of visuals
- Drill to the locations of visuals
- Visibility of visuals and shapes
- The Focus and Spotlight settings of visuals and shapes
There are many uses for bookmarks. Bookmarks can be used as an aid to report viewers so that they can reset the report page to a default state, removing all the filters and slicer
selections they have chosen. Bookmarks can also be created and grouped as a collection and used to create a step-by-step presentation to tell a story of interesting fi dings or insights.
Creating and using bookmarks
To see how bookmarks work, follow these steps:
- Click on the Details page while in the Report view.
- In the Visualizations pane, look at the Drill through area and ensure that there are no active drill-through filters. If there are, hover over the filter and remove it by clicking on the eraser icon (Clear filter), as highlighted in the following screenshot:
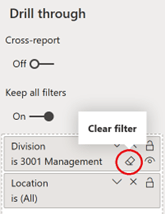
Figure 6.17 – The eraser icon, highlighted by a circle
When all of the drill-through filters have been removed, you should see Charlotte at the top of the page in the Card visual. You should also see all of the divisions and all of the locations in the Hours by Division and Hours by Location visuals, respectively.
-
Now that the page is in its proper state, collapse the Filters pane and the
Visualizations pane.
- In the ribbon, select the View tab and, in the Show panes section of the ribbon, select Bookmarks. The Bookmarks pane will appear between the collapsed Filters and Visualizations panes, as shown in the following screenshot:
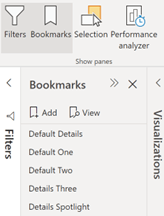
Figure 6.18 – Bookmarks pane
- In the Bookmarks pane, click Add. Bookmark 1 will appear.
- Rename this bookmark by double-clicking its name, typing Default Details, and then pressing the Enter key.
To use this new bookmark, follow these steps:
- First, click on Page 2.
- Right-click on 3001 Management in the Hours by Division visual, choose Drill through, and then Details. Here, we can see Cleveland at the top in our Card visual and only 3001 Management in our Hours by Division visual. Also, only Cleveland and Nashville appear in our Hours by Location visual.
- Now, click on the Default Details bookmark in the Bookmarks pane. The page will be automatically reset to its state when the bookmark was defined, removing the Drill through filters!
- Now, click back onto Page 2.
-
Click the Default Details bookmark again. You will be transported to the Details
page automatically!
As you can see, bookmarks can be used while on a page, as well as used as navigational aids between pages.
Advanced bookmarks
Let’s explore some more advanced options for bookmarks by following these steps:
- Make sure that you are on the Details page with the Bookmarks pane visible.
- In the Bookmarks pane, click the ellipsis (…) next to the Default Details bookmark and uncheck Current page.
-
Now, switch to Page 2 and use drill through in the Hours by Division
visualization to drill through to the Details page from 3001 Management.
- Click back onto Page 2 and select the Default Details bookmark from the Bookmarks pane. You will no longer be transported to the Details page. However, if you click on the Details page, you will see that the page has been reset to remove the Drill through filters.
Click on the ellipsis (…) for our Default Details bookmark in the Bookmarks pane and recheck Current page, as shown in the following screenshot:
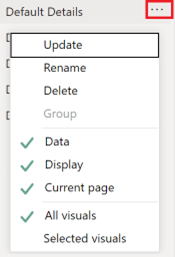
Figure 6.19 – Bookmarks options
-
Now, click on the ellipsis (…) for the Hours by Location visualization and choose
Spotlight. Note that the other visualizations fade into the background.
- Add a new bookmark using the Add button in the Bookmarks pane and call this bookmark Details Spotlight.
- Click on the ellipsis (…) for the Details Spotlight bookmark and uncheck Data.
-
Switch to Page 2 and Drill through to Details for 3001 Management in our
Hours by Division visualization once more.
- Note that the spotlight for the Hours by Location visual is gone.
- Click on the Details Spotlight bookmark. Note that the data stays the same; the Drill through filters haven’t been removed, but the spotlight returns for our Hours by Location visualization.
As you can see, the report author has a measure of control over what state a bookmark preserves. Let’s create some additional bookmarks, this time using the Selection pane:
- First, reset the Details page by clicking on the Default Details bookmark.
- To activate the Selection pane, click on the View tab in the ribbon. Then, in the Show panes section, choose Selection. The Selection pane will appear to the left of the bookmarks pane, as shown in the following screenshot:
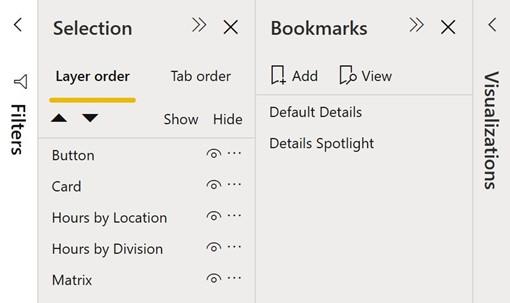
Figure 6.20 – Selection and Bookmarks panes
The Selection pane lists all of the visualizations and shapes on our report page:
- Button refers to the back button.
- Card refers to our Card visualization in the top right of our page.
- Hours by Location and Hours by Division refer to the respective visuals with the same names.
- Matrix refers to our Matrix visualization.
To understand how to use the Selection pane, do the following:
- Under the word Hide, note the eyeball icons.
- Click on the eyeball icon for Hours by Location. Note that the Hours by Location visualization disappears from the page and that there is now a slash through our eyeball icon.
- Hide the Hours by Division visual as well.
- Now, use Add in the Bookmarks pane to add a bookmark called Default One.
- Click on the Default One bookmark and drag and drop it above Details Spotlight but below Default Details.
- Click on the eyeball icon next to Hours by Division to show this visual on the page once more.
- Add another bookmark called Default Two and drag and drop this visual underneath Default One.
-
Now, show the Hours by Location visual by selecting the eyeball icon in the
Selections pane.
- Create another bookmark called Default Three and drag and drop this bookmark below Default Two. Your bookmarks should now be ordered like so:
- Default Details
- Default One
- Default Two
- Default Three
- Details Spotlight
-
In the Bookmarks pane, select View. Note that, at the bottom of the page, a gray bar appears that reads Bookmark 1 of 5 on the left-hand side and shows Default Details in the middle and three icons to the right.
-
Use the right-pointing Next icon to switch to the next bookmark in the list, that is,
Default One.
- Repeat this procedure to page through all of the bookmarks that we’ve created.
- Click on the X icon in the bookmarks bar or Exit in the Bookmarks pane to exit this slideshow of bookmarks.
- Reset the Details page by clicking on the Default Details bookmark.
- Close the Selection and Bookmarks panes by clicking on the X icons in their headers or using the View tab of the ribbon.
You now have a good understanding of how to use bookmarks in conjunction with the
Selection pane to structure a conversation about a report.
Now that you understand the basics of report navigational features, we will explore some advanced analysis techniques that can aid business users in gaining a deeper
understanding of the data in a visually appealing way. This will add to the overall utility of visualizations and reports.


