
Moving PivotTable reports
If you would like to move the PivotTable next to your data and not display the report on a separate worksheet, follow these steps:
-
Click the PivotTable Analyze tab at the top of your ribbon, then select the Actions
drop-down list. Choose Move PivotTable, as illustrated in the following screenshot:
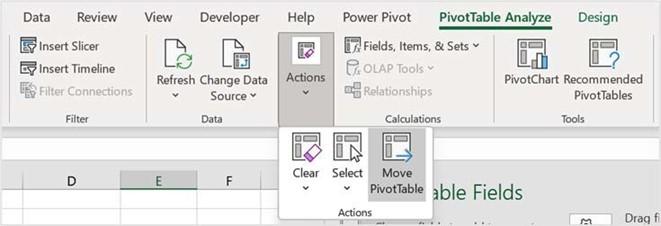
Figure 11.56 – Move PivotTable
- Select whether you would like to move to an existing worksheet or a new worksheet.
- Click on OK when you have chosen the desired option. The PivotTable is re-located.
Finally, we will learn how to use the GETPIVOTDATA function. This function is constructed to grab data (reference data) from a PivotTable cell.
Constructing the GETPIVOTDATA function
When working in a workbook that contains PivotTable reports, we may need to reference cells contained within a PivotTable report outside of the report on the worksheet. The GETPIVOTDATA function is great for this purpose. This function is available in the Lookup & Reference category in Excel.
There are a few constraints we need to be aware of when collecting PivotTable report references, which are discussed in the following steps:
- Open the workbook named PivotFormula.xlsx.
- Click to access the Pivot worksheet. Notice that the PivotTable report has already been created on this sheet in cells A1:M8. In cells A11:D14, we would like to populate data from our existing PivotTable report to use on the worksheet.
- Click into cell B14 on the worksheet. Press the = key, then click on a cell you wish to reference in the PivotTable report. In this case, we want to populate the Cases Sold in January per Label data. Select cell B5 in the PivotTable report.
- Notice here that the GETPIVOTDATA function is automatically referenced in the formula that appears:
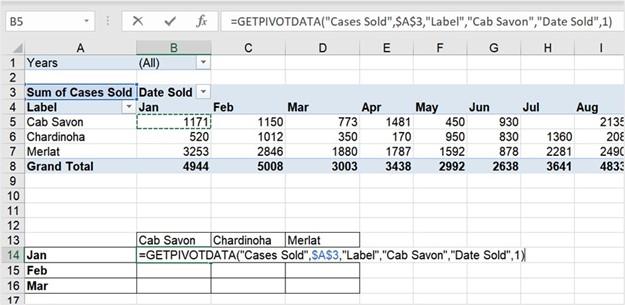
Figure 11.57 – GETPIVOTDATA function in action
- Press Enter to confirm.
- As the GETPIVOTDATA formula is hardcoded into the cell, we cannot copy the formula across and down to the remaining cells without receiving a #REF! error. Let’s fix the formula so that it enables us to autofill the values to other cells.
- Double-click on cell B14.
- Replace “Cab Savon” in the formula with the cell reference outside of the PivotTable report, by clicking on cell B13 (the Cab Savon heading). Be sure to apply absolute cell referencing to B13. The referencing would need to be applied to the row—that is, B$13.
- We also need to amend the month reference so that it updates by grabbing the relevant month when copying down the column. Months in a PivotTable are referenced as hardcoded month numbers 1 (January), 2 (February), and so on. Let’s replace the month number argument portion of the formula so that it updates for us.
- Replace 1 at the end of the formula by entering the ROW(A1) function so that it will count the months automatically from 1 (which equates to January), and so forth.
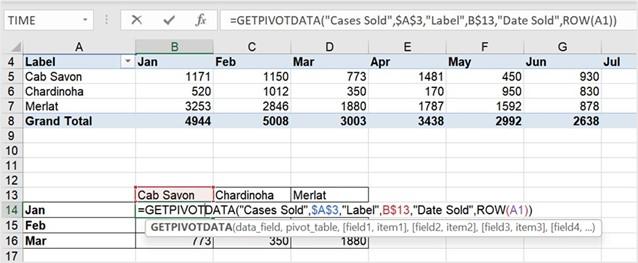
- Your formula is now constructed as follows: =GETPIVOTDATA(“Cases Sold”,$A$3,”Label”,B$13,”Date Sold”,ROW(A1)). You can see an illustration of this in the following screensh
Figure 11.58 – Completed GETPIVOTDATA formula
- Autofill the formula to the right and down to fill in the remaining values.
Summary
You have now learned valuable skills for visualizing and analyzing data in this chapter, using powerful tools such as PivotTable to create slicers and timelines, and you can now create dashboards and PivotCharts and customize your PivotTable reports. You are now able to put your date and time functions into practice as you are equipped with all the relevant functions applicable to each of these function categories.
In the next chapter, we will build on prior skills to work with math and trigonometry and statistical functions using Excel 2021 and introduce some additional functions to the mix. We will explore how to generate random numbers using RANDBETWEEN and RAND functions. In addition, we will work through examples of PRODUCT functions, including the SUMPRODUCT, MROUND, FLOOR, TRUNC, AGGREGATE, and CONVERT functions.
We will investigate the MEDIAN, COUNTBLANK, and AVERAGEIFS statistical functions in the next chapter, with which you can experiment and apply to existing or new scenarios when working with workbook data.


