
Changing the design theme
- Now that we have altered styles independently for each element on the dashboard, we can save time using Theme templates to change every element at the same time.
- Navigate to the Page Layout tab on the ribbon.
- Select the Themes dropdown, after which a list of Custom and Office themes will appear. Click through the list to choose a theme to apply to your worksheet. Notice that all elements of the worksheet update to the new theme as you are clicking through the options. You are also able to customize Theme Colors, Fonts, and
Eff cts options using the relevant buttons to the right of the Themes button.
- Once you have customized a theme, you can click on the Save Current Theme… option at the bottom of the Themes drop-down list. Once a name is provided, this theme will become part of your Custom themes area at the top of the list, as illustrated in the following screenshot:
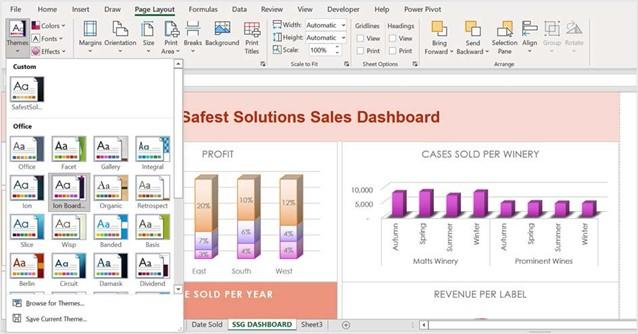
Figure 11.50 – Themes drop-down list
The dashboard is now complete and ready for other members of your company to interact with it. Let’s see how we can share dashboards with others.
Sharing your dashboard with others
Once you have finished creating your dashboard, don’t forget that you can share this with others using the Share button to the top-right of your Excel environment. Here’s how to do this:
- Click on the Share button, after which the Share pane will populate on the right- hand side of the screen.
- Enter the email address of individuals with which to share the dashboard. Add a message, if required.
- Make sure that the individuals you are sharing with can edit the dashboard so that they are able to interact with the filters.
- Click the Share button to send an invitation to the individuals concerned, or use the Get a sharing link option to copy the address directly into an email or browser. We can also share dashboards by creating a group in Outlook, then add your dashboard to the group and create a pin to the dashboard so that it resides at the top of the group. We will look at creating groups in the Outlook chapter of this book.
There are so many different features and elements to dashboards that we could cover, but we hope that we have given you enough substance to be creative and explore this exciting topic applicable to your business needs.
Let’s end this chapter with a few more PivotTable skills.
Additional PivotTable customizations
In our previous book, Learn Microsoft Offi e 2019, we learned to create PivotTables as an introduction to the tool. There are many features to explore to get the most out our of your PivotTable reports, a few of which are explained in the topics that follow.
Splitting data into separate worksheets
After you have created a PivotTable report, you can split the data into separate worksheets according to the category. Let’s open the workbook named SplitData.xlsx. Proceed as follows:
- Select the Pivot worksheet. Click on the PivotTable report to select it.
- Navigate to the PivotTable Analyze tab and select PivotTable | Options | Show Report Filter Pages…, as illustrated in the following screenshot:
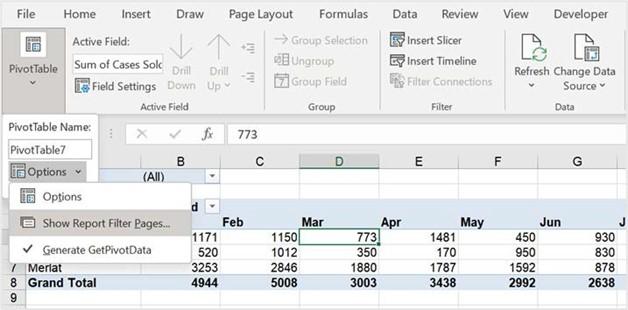
Figure 11.51 – Show Report Filter Pages… option
- Choose the Years filter option.
- Click on OK to confirm. The extra sheets are added to the workbook, splitting the data over each year.
In the next topic, we will learn how to change the settings of fields in the PivotTable Fields pane.
Changing value field settings
When we drag fields around the PivotTable Fields pane, the field might not take on the correct format of the data you require. Let’s learn how to amend this, as follows:
- Notice that the Employer Cost field in the Values area is reflecting the count of the value.
- As we do not want the count of the ER cost, we need to visit Value Field Settings…. Click the drop-down arrow to the right of the Count of the ER Cost field to see a list of options, as illustrated in the following screenshot:
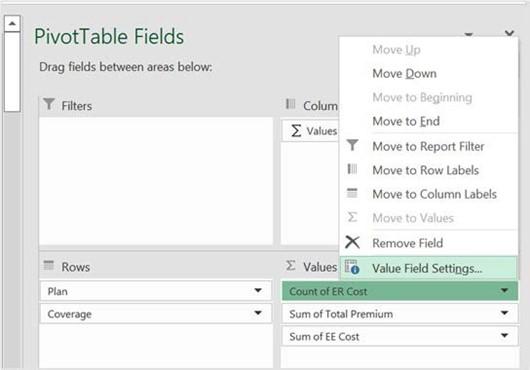
Figure 11.52 – Value Field Settings…
-
After selecting Value Field Settings, change the Count value to Sum, then click on
OK to confirm. The PivotTable updates to reflect the change.
Let’s learn how to change the percentage of a particular plan.
- To count how many employees are enrolled in plans, drag the Coverage field from the Field List pane to the Values area, as illustrated in the following screenshot:
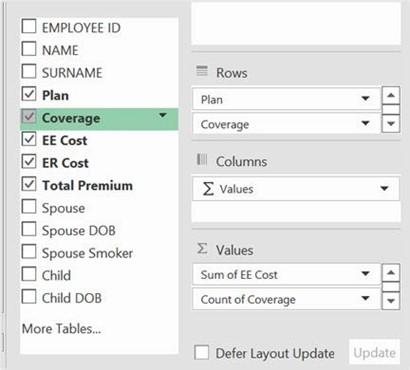
Figure 11.53 – Count of Coverage field in the Values area
Counting employees
The count of coverage is now evident in the PivotTable.
We need to change this value to see what percentage of people are enrolled in a plan versus a single level or family level of coverage.
- Right-click on any of the values in the Count of Coverage PivotTable report.
- Locate the Show Values As… option from the drop-down list, then slide right to select % of Parent Total….
-
Select Plan from the Show Values As (Count of Coverage) box, then click the OK
button to confirm.
- The PivotTable data updates to reflect the percentage of coverage, as illustrated in the following screenshot:
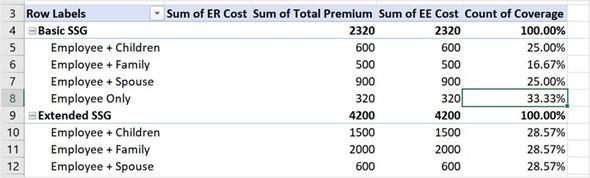
Figure 11.54 – Percentage of coverage
Now that we have amended the value to %, the heading does not quite fit the contents of the column. We will learn how to fix this in the next section.
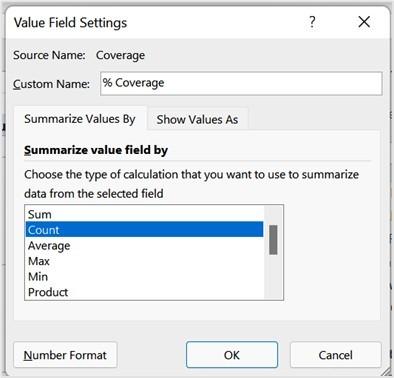
Amending column headings
-
To update our column heading so that it reflects the percentage and does not count, we rename the field exactly as we would usually do on a worksheet. The only thing you need to be aware of is that the name you use may already exist in the PivotTable fields area/existing dataset. You will receive an error to state that the field name already exists if this is the case.
If you need to use the same name, a space or underscore would need to be added so that it is not associated as a duplicate table field.
- Double-click on the column header to amend it, then type the new headings into the Custom Name: field provided, as illustrated in the following screenshot. Click on OK to confirm:
Figure 11.55 – Value Field Settings dialog to amend the heading
The column header is updated in the PivotTable report.
Let’s learn how to move a PivotTable if you would like it positioned on the actual worksheet and not as a separate worksheet.


