
Deploying, Governing, and Adopting Power BI
Now that you have learned the fundamentals of working with Power BI and have seen Power BI’s powerful analytics and visualizations features fi sthand, it is time to turn our attention to the broader topics of deployment, governance, and the adoption of Power BI within an organization. Th s chapter is designed to help you understand the organizational issues and requirements of Power BI within an enterprise. Understanding the bigger picture when it comes to Power BI will help you better understand and navigate the journey of Power BI
use and adoption within your organization. To this end, we cover the various deployment and usage scenarios used by most organizations. In addition, we cover the important organizational topics of governance and administration, providing detailed information on the confi tion of Power BI tenant settings, as well as a phased deployment process for the development and creation of Power BI content. Finally, we will cover the topic of adoption and propose adoption strategies that can assist in diffusing the disruptive technology of self- service analytics and business intelligence throughout an organization.
The following topics are covered in this chapter:
- Understanding usage models
- Governing and administering Power BI
- Adopting Power BI
Technical requirements
You will need the following to successfully complete this chapter:
- An internet connection.
- An Office 365 account or Power BI trial.
-
If you have skipped any of the previous chapters, you can download the LearnPowerBI.pbix file from GitHub at https://github.com/ PacktPublishing/Learn-Power-BI-second-edition.
- Check out the following video to see the Code in Action: https://bit. ly/3bWWGB3
Understanding usage models
Power BI provides considerable flexibility regarding how organizations deploy and adopt it. There are nearly limitless ways to organize and use such things as workspaces, apps, and dataflows, as well as how organizations choose to share and distribute content. We call the overall architecture and plan for how organizations deploy and utilize Power BI usage models. Usage models encapsulate how an organization adopts and utilizes the various components of Power BI in order to provide governance and processes around the use of Power BI.
The following sections explore some of the more common usage models for Power BI. However, keep in mind that there are nearly unlimited usage models as organizations can combine aspects of different usage models in different ways in order to facilitate the
particular needs of their organization. The usage models covered here can be thought of as archetypes, or base usage scenarios, that demonstrate particular desired outcomes or traits.
Anarchy
Many Power BI implementations start out as near chaos or anarchy, the grassroots adoption of Power BI by end users. This model is depicted in Figure 12.1:
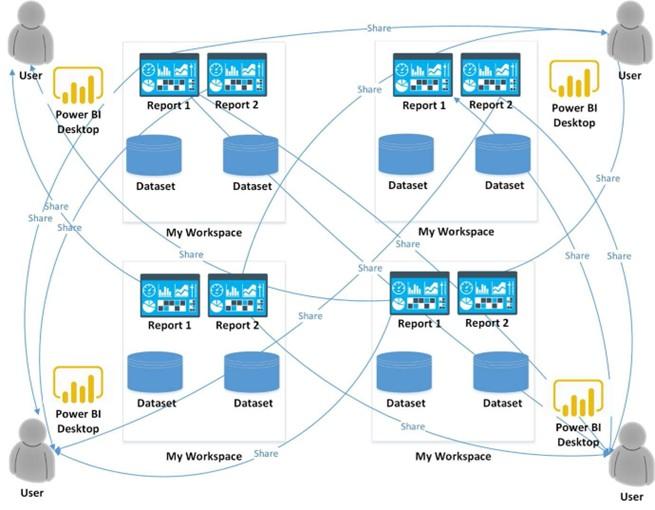
Figure 12.1 – Anarchy: No governing model for report development and sharing
If Figure 12.1 looks messy, that is intentional. In the anarchy model, end users just start connecting to data sources, building datasets, reports, and dashboards, and then sharing those reports with whomever. This is the epitome of grassroots, self-service business intelligence and mimics how many organizations use Excel. Under this model, there is little to no governance or control.
While the anarchy model empowers business users, there are definite drawbacks. For example, there is no real single source of truth. Different business users may calculate various business metrics differently. There can also be a tremendous amount of duplication of effort. Finally, without any official reporting, there is no guarantee that users are able to access and view the appropriate reports and dashboards.
It is important to understand that while the anarchy model should absolutely not be the end journey of an organization’s Power BI usage model, the anarchy model is present with all deployments of Power BI. All Power BI users get their own workspace, My workspace, where they can create their own datasets, reports, and dashboards. This is okay and is in fact a good thing. The anarchy model represents the citizen data analyst and citizen data scientist. It is a key component of building a data culture within an organization. And if anarchy is not occurring in Power BI, it is certainly occurring somewhere else, such as Excel. By leveraging Power BI for anarchy, users are free to explore and harness data and share their insights with others.
Centralized
At the opposite end of the spectrum from the anarchy model is the centralized model. In the centralized model, a single individual or group of individuals (often the IT department) control the creation of all official datasets, reporting, and distribution. The centralized model is shown in Figure 12.2:
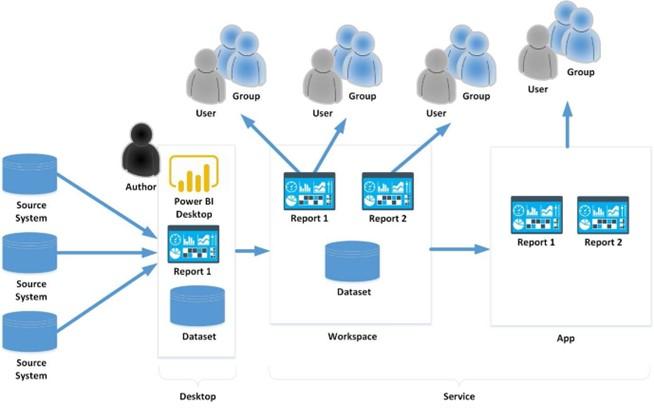
Figure 12.2 – Centralized: A central group controls report development and sharing
The main strengths of the centralized model are trust, governance, and efficiency. Because the datasets and reports are created by a central team of business intelligence professionals, the organization can trust that the metrics presented are consistent and accurate. In addition, efficiency is achieved since business intelligence professionals are likely more skilled than the average business user and since there is central control, it is unlikely that there will be duplication of effort.
The main weakness of the centralized model is difficulty scaling to large-sized organizations. The centralized model creates a funnel point for all official reporting and it is common for this to be a constraint to the business. Business users desiring certain information or metrics are required to make requests to the centralized team. It is not
uncommon for there to be more requests for reports than the centralized team can handle within a timeframe the organization desires, creating a backlog and leaving organizational users wanting. An additional weakness of the centralized model is one of requirement gathering. It is often necessary for a liaison to exist between the centralized IT team and the business users. IT people tend to know a lot about the technology side of the equation but are often not deeply knowledgeable about the actual business, the metrics important to the business, and exactly how the business users wish to view and interact with the data.
Distributed
To solve the scale issues inherent in the centralized model, organizations can adopt the
distributed model instead, as depicted in Figure 12.3:
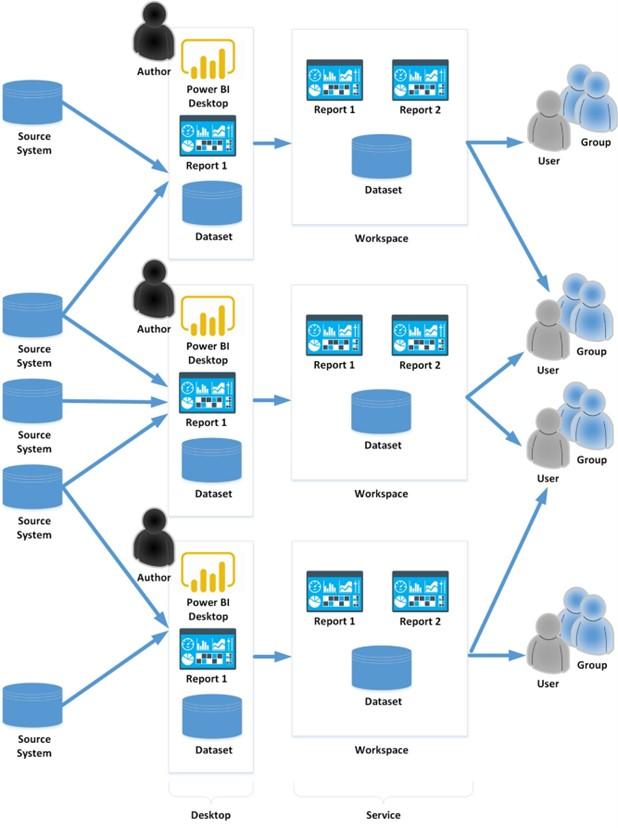
Figure 12.3 – Distributed: Report development and sharing is spread throughout the organization
Similar in concept to the centralized model, the distributed model solves the scaling problem by creating multiple teams of dataset and report authors, such as one per organizational unit or department. For example, the sales, finance, and supply chain departments would each have their own team of business intelligence professionals responsible for the creation of datasets and reports for their respective departments.
While the distributed model solves the scaling problem inherent in the centralized model, the distributed model can lead to the duplication of effort, metrics being calculated differently, and does not necessarily solve the need to translate requirements between the business and the distributed teams of business intelligence professionals.
Golden datasets
A popular method of asset development and deployment includes the concept of creating multiple reports off of a single, central dataset that serves as a data mart, sometimes called a golden dataset. This model is depicted in Figure 12.4:
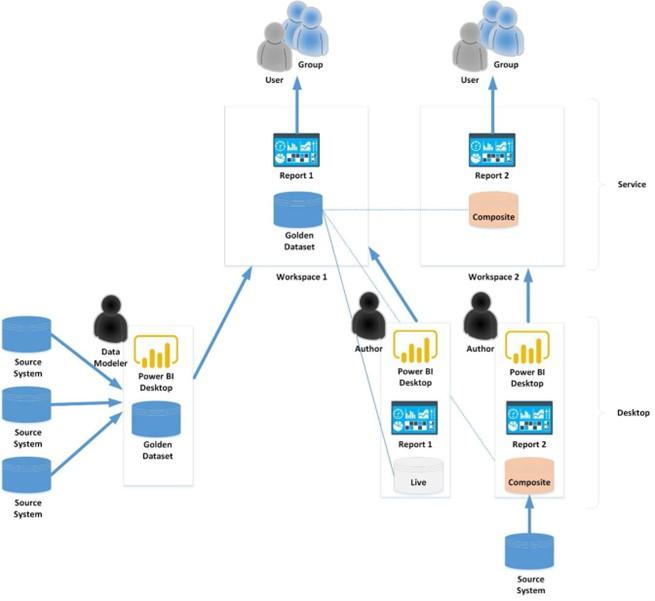
Figure 12.4 – Golden datasets: One group controls the data models, another group controls report creation and sharing
A golden dataset is derived from the term gold standard. A golden dataset represents the single source of truth or gold standard of cleansed data and consistent business metrics. Under the golden dataset model, a central team of business intelligence professionals (usually IT) is solely responsible for the creation of datasets and business metric calculations. These datasets are often created and published without any official reporting. The report creation is done by separate teams of content creators who connect live to the dataset within their own PBIX files and develop reports. Content creators may use only the golden dataset for their content or may create composite models that combine the golden dataset with additional data.
The golden dataset model is popular because it facilitates the separation of duties between the IT team and the business. The IT team is concerned with data lineage, dataset sprawl, and the accuracy and consistency of metrics and governs and controls the creation of datasets while the business users, who deeply understand their business domain and desire speedy analysis and reporting, control the creation of content. In this way, the golden dataset model provides the best of both worlds between the centralized and distributed model approaches.
Hybrid
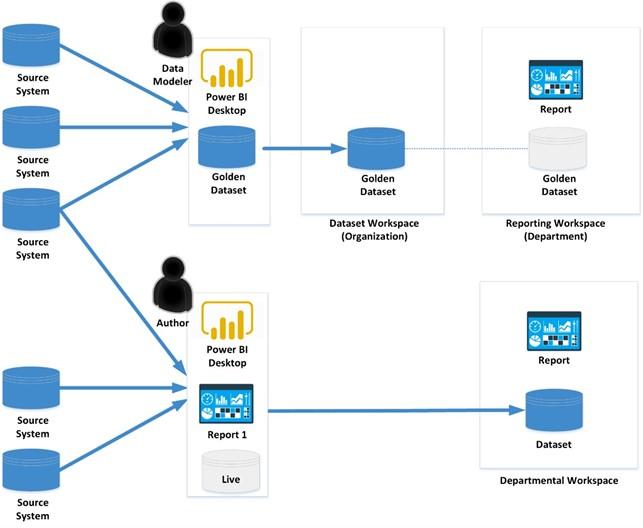
It is not uncommon for multiple usage models to be used simultaneously within the same organization in order to accommodate different needs within the organization. One such hybrid model is shown in Figure 12.5:
Figure 12.5 – Hybrid: A combination of multiple governance models
In the hybrid model depicted in Figure 12.5, the organization has chosen to combine the golden dataset model with the distributed model. The golden datasets are used for
official organizational content created by the centralized team of IT business professionals. However, departmental workspaces are also created to allow the individual departments within the organization flexibility in creating content that is used internally within
the department.
The examples covered here are simply examples of some of the more common usage models found within organizations that use Power BI and are certainly not the only ways in which organizations might deploy and leverage Power BI. However, keeping these base archetypes in mind will help you determine the correct usage model or combination of usage models that will meet the needs of your organization.
Now that we have learned about a number of different usage models for Power BI, let’s next take a closer look at governing and administering Power BI.


