

Verifying and loading data
Now that we are finished connecting to and transforming the data, there should be three active queries and four intermediate queries listed in the Queries pane.
The active queries include Budgets and Forecast, People, and Hours. These should not be italicized. These are the active queries that will create tables in the data model. There should also be four intermediate queries for Tasks, January, February, and March that are italicized. These queries will not create tables in the data model but will be used by the active queries.
The Queries pane should look as follows:

Figure 4.19 – Queries pane
We can view how our sources and queries are related to one another by viewing the query dependencies. We can do this by performing the following steps:
- In Power Query Editor, click on the View tab of the Ribbon.
- Click the Query Dependencies button in the Dependencies area of the Ribbon. This displays the Query Dependencies window, as shown in the following screenshot:

Figure 4.20 – Query Dependencies window
-
Click on the Tasks query to highlight the sources and other queries related to the
Tasks query.
- When you have finished exploring, click the Close button.
The Query Dependencies window is useful for understanding how queries are related to one another and how queries are organized.
Organizing queries
Now, let’s organize our queries by grouping queries together. In this case, we will create groups for our active and intermediate queries. To do this, perform the following steps:
- In Power Query Editor, in the Queries pane, right-click the Hours query and select Move To Group and then New Group. The New Group dialog will be displayed, as shown in the following screenshot:

Figure 4.21 – New Group dialog
- For Name, enter Active and, in the Description box, enter Queries that become tables in the data model.
-
Click the OK button. Note that two folders are created: an Active folder and an
Other Queries folder.
- Select the Budgets and Forecasts query and right-click it.
- Choose Move To Group and then Active.
- Repeat this process for the People query.
We now have our queries organized into Active queries and Other Queries. Organizing queries into groups is not required but beneficial, especially as more queries are added to your models.
Checking column quality, distribution, and profiles
As a final check before loading our data, Power Query Editor includes powerful tools that allow us to understand the quality of our data. These tools can be found on the View tab of the Ribbon, in the Data Preview section.
To use these features, perform the following steps:
- Click on the Hours query in the Active group in the Queries pane.
-
Click the View tab of the Ribbon and check the box next to Column quality in the
Data Preview section:
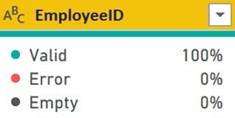
Figure 4.22 – Column quality for the EmployeeID column
As shown in the preceding screenshot, note that under the column headers, information is displayed regarding the quality of the data in each column. This information includes what percentages of row values are Valid, Error, or Empty. Errors can be caused by transformation steps in the query, especially when you’re attempting to transform the data type of a column. For example, when changing a column to a Date data type, inserting a value of 12/32/2021 into a row will create an error because that value cannot be converted into a date.
- In the View tab of the Ribbon, click the checkbox next to Column distribution. This same area will now display additional information regarding the distinct and unique values that were found in the rows of each column. This information is based on the first 1,000 rows returned by the query:

Figure 4.23 – Column distribution for the EmployeeID column
Note that the exact statistics found here may vary, depending on the order in which you appended your queries.
- Finally, in the View tab of the Ribbon, click the checkbox next to Column profile. Note that two additional areas are displayed; that is, Column statistics and Column distribution:
Figure 4.24 – Column profiling
Again, the exact statistics that are displayed will vary, depending on the order in which you appended your queries.
This completes the transformation process for our data. Our final step is to load the data into the data model.
Loading the data
Now that we have organized our queries and verified the data’s quality, it is time to load the data from the queries into Power BI:
- In Power Query Editor, click the Home tab of the Ribbon.
-
On the far left of the ribbon, click the Close & Apply button.
Clicking this button closes the Power Query Editor window and loads the data from the queries into Power BI Desktop. When this is complete, we will have four tables listed in the Fields pane called Budgets and Forecasts, Calendar, Hours, and People, as shown here:
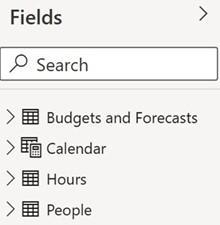
Figure 4.25 – Loaded tables
Now is a good time to save your work by clicking the Save icon in the Header or by choosing File and then Save in the Ribbon.
Summary
In this chapter, we explored the Power Query Editor, the powerful sub-application that’s used to ingest and shape data through the creation of queries. Queries are a series of recorded steps for connecting to and transforming data. We connected to multiple data files and learned how to clean up and transform the data to support further analysis. Next, we learned about more advanced operations such as how to merge, copy, and append queries. Finally, we explored some built-in data quality and profiling tools that summarize, visualize, and provide statistical information about the data we are ingesting.
In the next chapter, we will build a data model by connecting the tables created by these queries to one another via relationships. We will also build the necessary calculations that will complete our model.
Questions
As an activity, try to answer the following questions on your own:
- How many different connectors are available for ingesting data in Power BI?
- What is the powerful sub-application included with Power BI that’s used for ingesting and shaping data?
- What is the name of the language that’s used behind the scenes when creating queries?
- Turning columns into rows is called what?
- What icons are displayed in the headers of columns for text, whole number, decimal, and date columns?
- Joining two queries together based on columns is called what?
- What are the six different kinds of join operations that can be performed when joining queries?
- Adding one query to another query is called what?
Further reading
For more information on what was covered in this chapter, take a look at the following resources:
- Data sources in Power BI Desktop: https://docs.microsoft.com/en-us/ power-bi/desktop-data-sources
- Connect to Excel in Power BI Desktop: https://docs.microsoft.com/ en-us/power-bi/desktop-connect-excel
- Query overview in Power BI Desktop: https://docs.microsoft.com/ en-us/power-bi/desktop-query-overview
- Perform common query tasks in Power BI Desktop: https://docs.microsoft. com/en-us/power-bi/desktop-common-query-tasks


