Working with goals
Goals and scorecards are relatively new types of objects in the Power BI service that allow users to track key metrics against business objectives. Goals provide something for teams to measure their progress toward achieving business objectives against, with the ability
to share updates and analyze detailed data when necessary. Goals can be organized into scorecards that incorporate content from multiple workspaces in order to provide a single window into the health of an organization.
Goals require a Power BI Premium capacity or a Premium Per User (PPU) license. Let’s explore how you create and use goals and scorecards in the service.
Creating scorecards and goals
To create a new scorecard, do the following:
- Navigate to a Premium workspace (designated with a diamond icon).
- Click Goals in the Navigation pane.
-
Click the New scorecard button in the upper right of the canvas. This displays the
Create scorecard dialog, as shown in the following screenshot:
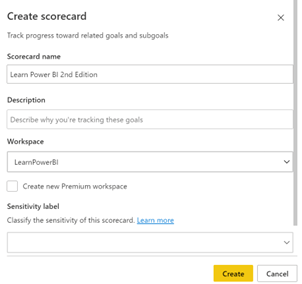
Figure 10.17 – Create scorecard dialog
-
Provide a name for your scorecard in the Scorecard name field and click the
Create button.
-
Click the New goal button.
Create a manual goal, like the one configured in the following screenshot:
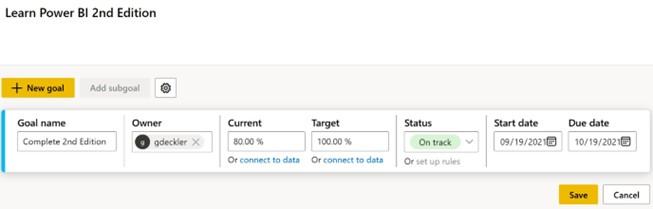
Figure 10.18 – Creating a goal
- Click the Save button. A scorecard is presented, as shown in the following screenshot:
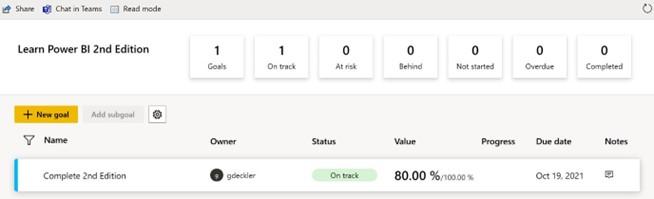
Figure 10.19 – A completed scorecard
While this is a simple example, you can see how goals and scorecards can provide an easy way to track progress against a variety of different goals. Even better, the creation of a scorecard creates a corresponding dataset within the workspace that holds all of the goal information and progress. This dataset can be used to create custom reports.
Using scorecards and goals
Let’s explore some things that we can do with scorecards and goals. First, let’s update our goal’s progress. To do this, perform the following steps:
- On the far right, click on the icon under the Notes column for the goal.
- Click on the New check-in button to create a new check-in for the goal, as shown in the following screenshot:
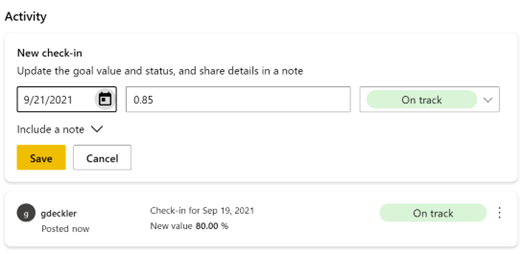
Figure 10.20 – New check-in
- Enter a new check-in and click the Save button.
Creating check-ins allows the progress toward the goal to be updated and tracked over time. Next, let’s add a data-driven goal. To do this, follow these steps:
- On the scorecard, click Edit in the ribbon if not already in Edit mode.
- Click the New goal button.
- Provide a name for your goal in the Goal name field, and then, under Current, click the Connect to data link.
- Select the LearnPowerBI2ndEdition report from the list of reports and then click the Next button.
-
Navigate to the Executive Summary page of the report, click the % Utilization vs. Target by Month KPI visual and then click the Connect button. Refer to the following screenshot:
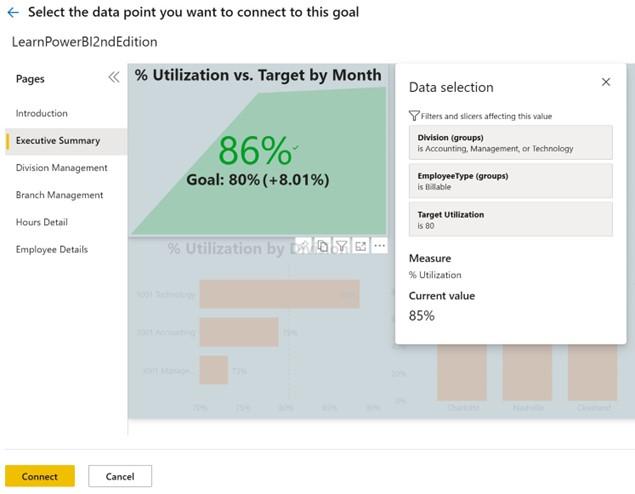
Figure 10.21 – Creating a data-driven goal
-
Back on the scorecard edit screen, enter a Target value of .8 and then click the
Save button.
- Click the icon under the Notes column for the new goal.
- Click the Status rules tab and then click the New rule button.
- Configure the Status rules settings, as shown in the following screenshot, and then click the Save button:
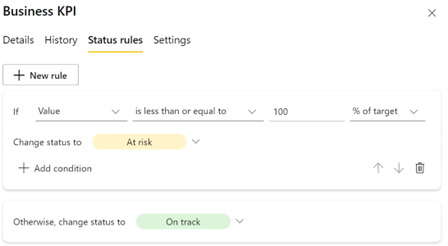
Figure 10.22 – Creating a data-driven goal
Now, instead of having to update the status manually via check-ins, the status of the goal will be updated automatically every time the dataset is refreshed.