Using Reports in the Power BI Service
Now that we have published a report to the Power BI service and understood the basics of how to operate within the service, there are many other features of the service that are important to understand. The service has its own extensive feature set, such as sharing and commenting, that adds significant capabilities to Power BI in addition to just using the Desktop version alone. Understanding these features and capabilities will allow us
to maximize the value of Power BI for any organization. Chief among these is how to use reports within the service. This chapter explores all of the different features that are available when using reports in the service, including how to collaborate on reports, receive regular updates, use bookmarks, and so on.
To understand the full capabilities of reports within the Power BI service, the following topics are covered in this chapter:
- Viewing and using reports
- Editing and creating reports
Technical requirements
You will need the following requirements to successfully complete this chapter:
- An internet connection.
- An Office 365 account or Power BI trial account.
- If you have skipped any of the previous chapters, you can download LearnPowerBI.pbix from GitHub at https://github.com/ PacktPublishing/Learn-Power-BI-second-edition.
- If you have skipped any of the previous chapters, you can download LearnPowerBI.pbix from GitHub at https://github.com/ PacktPublishing/Learn-Power-BI-second-edition.
- Check out the following video to see the Code in Action: https://bit. ly/3F0jqwM
Viewing and using reports
The reporting interface within Power BI provides a number of useful functions when viewing reports. Some of these functions are similar to the features within Power BI Desktop, while others are unique to the service. You will see different options depending on whether you own a report or have read permissions to a report. The features and
functionality described here encompass all of the options present as if you owned the report.
The first difference between Power BI Desktop and the Power BI service that most users will notice is that there is a Pages pane located to the left of the report versus the Page tabs in the Desktop version. All pages in the report except for hidden pages
will be listed in the Pages pane. This Pages pane can be collapsed or expanded using the
<< and >> icons, respectively.
The functions for reports within the service can be accessed by using the slim ribbon bar that appears above your report, as shown in the following screenshot:

Figure 9.1 – Report ribbon in the service
Additional items in the report ribbon include the following:
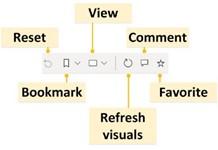
Figure 9.2 – Additional report ribbon options in the service
We will now explore all of the various options and functionality present within this ribbon bar.
File menu
The File menu provides a variety of important options and features for managing and working with reports while in the service, as illustrated in the following screenshot:
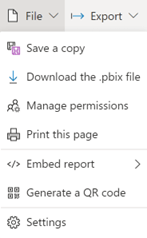
Figure 9.3 – File menu in the service
Let’s explore all of the options shown in Figure 9.3.
Save a copy
Clicking Save a copy brings up a Save your report dialog that allows you to enter a new name for your report. Once you click the Save button, your report is saved under a new name within the current workspace.
Download the .pbix file
The Download the .pbix file menu option creates a Power BI Desktop (PBIX) file that can be downloaded from the service.
Manage permissions
Clicking Manage permissions brings up a page that allows you to manage the sharing of links created, users with direct access to the report, as well as pending access requests,
as shown in the following screenshot:
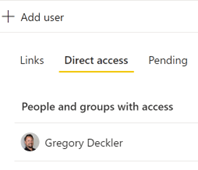
Figure 9.4 – Manage permissions dialog in the service
Th Links tab displays any sharing links that have been created for the report and allows you to add new links via an Add link button. Clicking the Add link button brings up the same dialog as clicking the Share button in the report ribbon. Links can be edited and removed.
The Direct access tab displays all users that currently have direct access to the report and allows you to add new users via an Add user button. When adding a user, as shown in the following screenshot, the user is added with Read permissions to the report and can also be granted reshare and build rights as well. These rights allow the user to reshare the report with others or build new reports based on the underlying dataset, respectively.
Users can also be removed or have their permission settings changed on this tab:
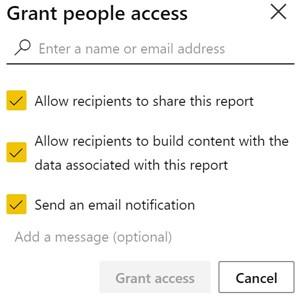
Figure 9.5 – Add user dialog in the service
The Pending tab allows you to accept or reject pending requests to view the report. When attempting to view a report in the service that you do not have access to view, you will
be provided the option of requesting access to the report. Those requests appear on the
Pending tab.
Print this page
Perhaps surprisingly, printing is a function that’s only available in the Power BI service and not Power BI Desktop. Clicking the Print button brings up a print dialog that allows you to print a report using local printers. The print dialog is shown in the following screenshot:
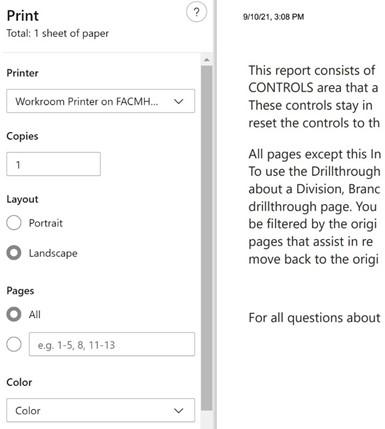
Figure 9.6 – Print dialog
Make sure to switch the Layout setting to Landscape to maximize your report’s size and ensure that visuals are not cut off of the page.
Embed report
Embedding allows reports to be inserted into websites so that just the report canvas area is displayed. Embedding reports can be done in three different ways, as outlined here:
- SharePoint Online
- Website or portal
- Publish to web (public)
Let’s explore the different embedding options.
SharePoint Online
Clicking SharePoint Online generates a secure embed code that’s specifically designed for use in SharePoint Online. As with other embed codes, this embed code enforces authentication and all security within the report. Unlike other embed codes, SharePoint embed codes do not support the filter query string parameter. See Using URL parameters with embed codes in this section.
Website or portal
Clicking Website or portal creates a secure embed code designed to be used within external websites. Secure embed codes require authentication to the Power BI service in order to display reports. All report security, such as Row-Level Security (RLS), is enforced within the embedded report.
Creating a secure embed code does not grant permissions to a report. Permissions to the report must be set separately by using the Share function or in the Manage permissions interface. This means that viewers of the report that use the embed code must have
a Power BI Pro or Premium Per User (PPU) license, or the report must be published to a Power BI Premium workspace.
Clicking the Website or portal option brings up the Secure embed code dialog, as shown in the following screenshot:
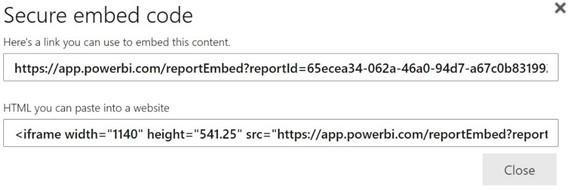
Figure 9.7 – Secure embed code dialog
There are two types of embed code: a raw embed code (the top link in the preceding screenshot) and a HyperText Markup Language (HTML) embed code (the bottom link in the preceding screenshot). The raw embed code is simply a secure link to the report.
This link can be used within any website or portal that provides the ability to embed by using such a link. Alternatively, this link can be used as a direct link to the report.
For example, the top link presented in the dialog can be pasted directly into a browser’s
Uniform Resource Locator (URL) bar.
The HTML embed code is an Inline Frame (IFRAME) HTML snippet. IFRAMEs are HTML tags that are used to include content from other websites within a web page. Thus, to use the HTML embed code, the snippet of HTML must be pasted within the HTML code of a web page. When using the HTML embed code snippet, you may need to adjust the width and height parameters of the snippet in order to properly display the report within your website.
Publish to web (public)
The Publish to web option works identically to the Website and portal option, with one important difference: security is not enforced. This means that anyone with the embed code or HTML snippet can view the report free of any security. As such, the Publish to web option is not available on reports that include RLS. In addition, there are numerous other restrictions when using Publish to web embed codes regarding the type of visuals and features supported. Some of the restrictions include the following:
- Cannot use R or Python visuals
- Cannot use ArcGIS Maps visuals
- Cannot use Q&A visuals
- Cannot use live connections
- Cannot use shared or certified datasets
When clicking the Publish to web option, you are initially presented with a screen informing you of the terms of use, stating that you can only use the code on a public website. Click the Create embed code button to proceed. You are then informed on a second screen that anyone who has the embed code can view the report. Click the
Publish button to proceed. Clicking Publish displays the dialog shown in the following screenshot, as well as enabling you to preview the report:
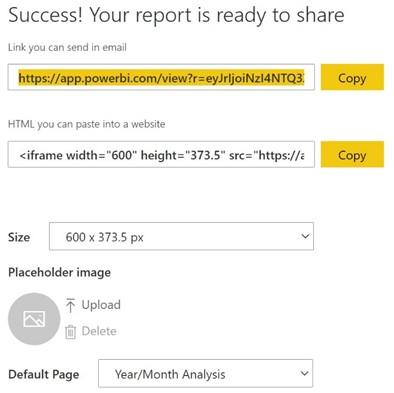
Figure 9.8 – Embed dialog for Publish to web
Obviously, you should not use Publish to web when sharing secure or sensitive information. Publish to web is only intended to be used when sharing work that could potentially be seen by anyone in the world. Because security is not enforced, anyone that has the embed code can turn around and resend or share that embed code with additional people, and those individuals could also see the report.
Th s feature is used heavily for community content such as on the Power BI Community website (community.powerbi.com). The Data Stories Gallery (https://community.powerbi.com/t5/Data-Stories-Gallery/bd-p/ DataStoriesGallery) and Quick Measures Gallery (https://community.
powerbi.com/t5/Quick-Measures-Gallery/bd-p/QuickMeasuresGallery) are good examples of proper use of the Publish to web feature.
As mentioned, once a Publish to web embed code has been created, anyone with the code can get access to the report, free of any security, including authentication. These embed codes can be managed so that you can retrieve the embed codes as well as delete them.
Let’s get started, as follows:
-
To access the Manage embed codes interface, click the ellipsis (…) in the header portion of the Power BI service page, choose Settings, and then Manage embed codes, as shown in the following screenshot:
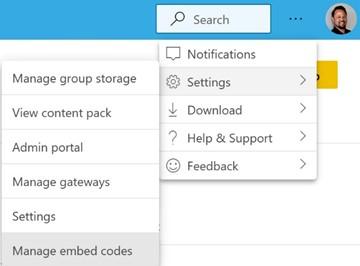
Figure 9.9 – Accessing Manage embed codes
- Choosing this option brings up the Manage embed codes interface, which includes a list of all reports for which a Publish to web embed code has been created, as illustrated in the following screenshot:
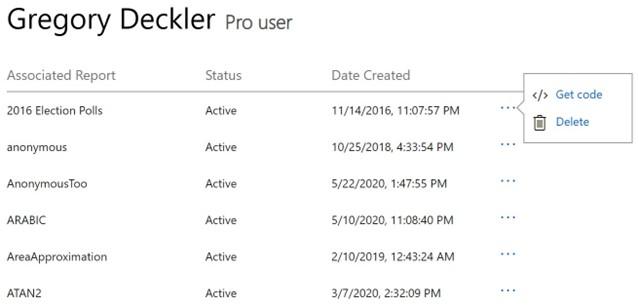
Figure 9.10 – Manage embed codes page
- From this interface, as shown in Figure 9.10, Publish to web embed codes can be retrieved as well as deleted by clicking on the ellipsis (…).
- To retrieve a Publish to web embed code, click on the Get code option. To delete a Publish to web embed code, click on the Delete option.
Now that we have covered the different types of embed code, let’s next take a look at how you can use URL parameters with the different types of embed code.
Using URL parameters with embed codes
Both Web and portal and Publish to web embed codes include the ability to use special URL parameters in order to control the display of the embedded report. These parameters are included in the query string portion of the URL.
The query string portion of a URL is the portion of the URL that is after the question mark (?). For example, note the bold ? character in the following code snippet:
https://app.powerbi.com/reportEmbed?reportId=0982-4e14-bbf7- ddb60a89ab43&autoAuth=true&ctid=373a-43d2-827b-003f4c7ba1e5
Multiple query string parameters can be used by separating the parameters with an ampersand (&) sign. For example, the preceding URL includes three separate query string parameters, as follows:
- reportId
- autoAuth
- ctid
Two additional parameters can be added to the query string of the URL, as outlined here:
- pageName
- filter
To add a pageName parameter, follow these steps:
-
Navigate to the page in the service. Note the URL in the browser’s URL bar after the last / mark, as shown in the bold portion of the following code snippet:
https://app.powerbi.com/groups/5cfe-4911-8c19- 6cd0c4a05316/reports/0982-4e14-bbf7- ddb60a89ab43/ ReportSectione40aa5b8b28a3bc92793
This is the report page name portion of the URL.
-
To force this particular page to be displayed when initially loading the report, edit the embed code as follows:
https://app.powerbi.com/reportEmbed?reportId=0982-4e14-bbf 7-ddb60a89ab43&autoAuth=true&ctid=373a-43d2-827b-003f4c7ba 1e5&pageName=ReportSectione40aa5b8b28a3bc92793
The filter parameter can also be used to filter the initial display of the report. The filter parameter has the following format:
filter=Table/Field eq ‘Value’
To add a particular filter to the embed code that initially only displays the 1001 Technology division, the URL can be edited like so:
https://app.powerbi.com/reportEmbed?reportId=0982- 4e14-bbf7-ddb60a89ab43&autoAuth=true&ctid
=373a-43d2-827b-003f4c7ba1e5&pageName=Rep ortSectione40aa5b8b28a3bc92793&filter=Hours/Division eq ‘1001 Technology’
The Table and Field portions of the parameter are case-sensitive to the names in the data model, while the Value portion is not.
Generate a QR code
The Generate a QR code option creates a Quick Response (QR) code that links to the report in the service, as shown in the following screenshot. This code can be downloaded and shared with others:
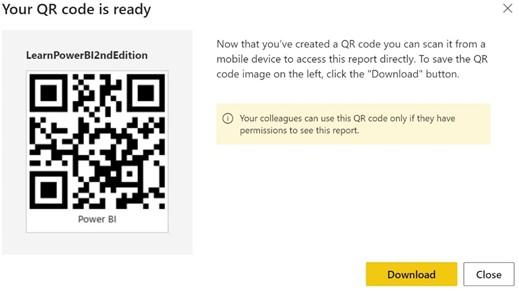
Figure 9.11 – Generate a QR code dialog
Next, let’s look at Settings!
Settings
Choosing Settings from the File menu opens a pane on the right-hand side of the screen that lists many different settings that can be enabled, disabled, or changed for the report. These settings mainly control the experience of others viewing the report and include the following:
- Report name: The name of the report.
- Description: A description for the report.
- Contact: Who to contact regarding the report.
- Snapshot: An image snapshot of the report.
- Endorsement: Endorsing a report helps other organizational users find your report and trust that its content is reliable. Endorsement can be set to None, Promoted, or Certified. The Certified option may be grayed out, depending upon your Power BI administrator settings. You can also check the box for Feature on Home to display the report in the Features section of the Power BI home screen.
- Persistent filters: Enables or disables the ability of other users to save filters on the report.
- Pages pane: Controls whether the report pages are displayed in the Pages pane or as tabs along the bottom of the report, as in the Desktop version.
- Visual options: Visual options include the ability to enable or disable the header for visuals when in reading view as well as whether the default interaction between visuals is cross-highlighting or cross-filtering.
-
Export data: This setting controls the kind of data users are allowed to export from the report and whether this can be done at all. The options include Summarized data, Summarized data and underlying data, and None. The Summarized
data option essentially allows users to export the data presented in a visual. The data export is the information presented by the visual. Thus, if the three markets, Charlotte, Nashville, and Cleveland had 89%, 86%, and 83% utilization, then this would be the information exported. Conversely, Summarized data and underlying data would allow users to export the individual data records that were summarized to arrive at the data displayed in the visual.
- Filter experience: This allows you to enable or disable the ability of users to change filter types as well as enable or disable search functionality for the Filters pane. Filter types refer to such things as manual filters, auto filters, include/exclude filters, drill-down filters, and so on. See the Further reading section of this chapter for more information on filter types.
- Cross-report drill through: This allows you to toggle on or off the ability of visuals in the report to use other reports as drill-through targets.
- Comments: You can either enable or disable comments for the report.
- Personalize visuals: Toggles on or off the ability of users to personalize visuals.
- Modern visual tooltips: Enables or disables modern visual tooltips. See the following screenshot for a representation of this:
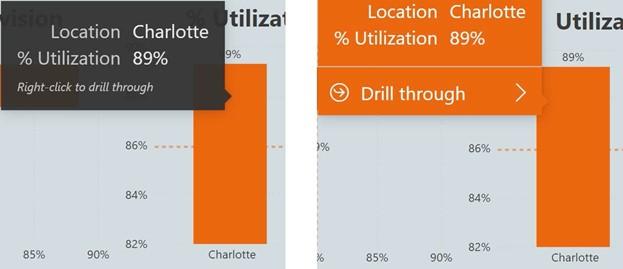
Figure 9.12 – Traditional tooltips (on the left) versus modern tooltips (on the right)
We are now finished with exploring the File menu and will now continue to explore the rest of the menu options in the ribbon.
Export menu
The Export menu provides three different options, as follows:
- PowerPoint
- PDF
- Analyze in Excel
PowerPoint
The PowerPoint option is used to export all of the pages of a report to a PowerPoint file. Use the following steps to export a report or portions of a report to PowerPoint:
-
Click on the PowerPoint option to display the Export dialog, as shown in the following screenshot:
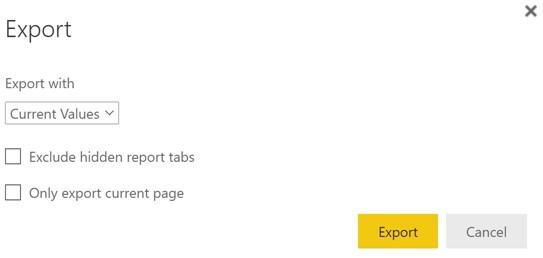
Figure 9.13 – PowerPoint Export dialog in the service
- Use the Export with drop-down menu to export the report with either the current values (filters and slicers) within the report or the default values for the report.
- To not include hidden report tabs, check the Exclude hidden report tabs checkbox.
- You can export all of the pages of the report, or to only export the current page, click the Only export current page checkbox.
- Click the Export button to create a PowerPoint file. Let’s look at the next option, PDF!
The PDF option is used to export all of the pages of the report to a Portable Document Format (PDF) file. Clicking on the PDF option displays the same Export dialog as the PowerPoint option shown in Figure 9.13
Analyze in Excel
This option will first check whether Analyze in Excel software is installed and, if not, will prompt you to install the required software. Once installed, an Excel file will be downloaded that contains a live link to the Power BI dataset for the report. To utilize the file locally, you will need to enable external data connections when prompted in Excel. Once enabled, you may use the dataset’s tables and columns to create PivotTables and PivotCharts within the Excel file.
Share
Clicking the Share button in the ribbon opens the Send link dialog, as shown in the following screenshot:
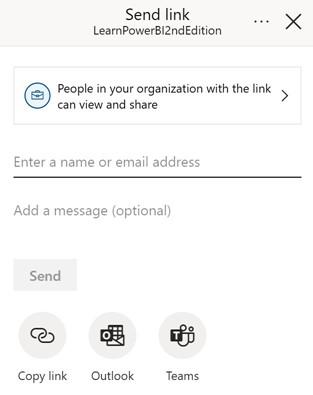
Figure 9.14 – Send link dialog in the service
The dialog defaults to generating a link that everyone within your organization can use to view and reshare a report. You can add the names of individuals to send this link to and then click the Send button. Alternatively, you can use the three icons at the bottom to simply copy the link to your clipboard, open an Outlook email message with the link contained in the body of the email, or post the link to a particular person, group, or channel in Microsoft Teams.
You can edit the permissions for the link created by clicking on People in your organization with the link can view and share in order to display the second page of the Send link dialog, as shown in the following screenshot:

Figure 9.15 – Secondary Send link dialog in the service
As shown in Figure 9.15, you can control who the link functions for as well as permissions. For example, in Figure 9.15, the permissions have been changed such that the link is intended to only work for specific people, and when using that link, the user will not be allowed to reshare the report or build new reports based on the underlying data. When you have configured the settings, click the Apply button to return to the original Send link dialog displayed in Figure 9.14 with the updated settings.
The Send link dialog shown in Figure 9.14 also provides access to a Manage permissions
function via the ellipsis (…) in the header, as shown in the following screenshot:

Figure 9.16 – Manage permissions function
Choosing Manage permissions opens the Manage permissions pane on the right side of the screen. This pane displays links that have already been created, as well as those users with direct access to the report, as shown in the following screenshot:
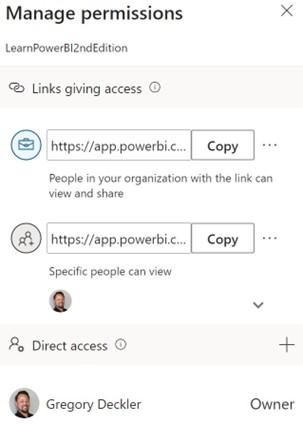
Figure 9.17 – Manage permissions dialog in the service
Users with direct access to the report can be added using the + icon in the Direct access header. Clicking the + icon brings up the same interface as shown in Figure 9.5 and functions identically. Links can be copied using the Copy button next to the link. In addition, clicking the ellipsis (…) to the immediate right of the Copy button allows the link’s permissions to be edited and deleted.