Planning Projects with Power BI
Power BI projects are essentially the same as business intelligence projects involving alternative tools such as Tableau, Qlik, MicroStrategy, SQL Server Reporting Services (SSRS), or even Crystal Reports. In fact, all business intelligence projects follow,
or should follow, a similar process, with only minor variations depending upon the specific technology being implemented.
In this chapter, we explain the general process for business intelligence projects with specific callouts for planning considerations specific to Power BI. In addition,
we introduce the specific business scenario that is used throughout this book.
The following topics will be covered in this chapter:
- Planning Power BI business intelligence projects
- Explaining the example scenario
Planning Power BI business intelligence projects
As explained in the previous chapter, in the Power BI Desktop section, Power BI business intelligence projects involve getting data from data sources, creating a data model,
and then creating and publishing reports and dashboards that are consumed by the business and used to answer specific questions or support the analysis of the efficiency, effectiveness, and profitability of the business. However, successfully delivering the desired insights and analysis to the business requires careful planning and should include the following activities:
- Identifying stakeholders, goals, and requirements
- Procuring the required resources
- Discovering the required data sources
- Designing a data model
- Planning reports and dashboards
Identifying stakeholders, goals, and requirements
Business intelligence projects are most often driven by the business as opposed to IT. This means that one of the business domains, such as sales, marketing, manufacturing/ production, supply chain/operations, research and development, human resources,
or accounting/finance, is attempting to answer specific questions about the business or better understand how to make the business more efficient, effective, and profitable.
Therefore, it is imperative that any business intelligence project starts with identifying the specific goals or objectives of all interested parties or stakeholders that are championing the business intelligence project as well as any specific requirements in terms of data security, granularity of the data, the amount of historical data, and the availability of data.
Stakeholders
Stakeholders are vitally important to the success of any business intelligence project, as the stakeholders define the goals and requirements of the business intelligence project and ultimately determine whether the business intelligence project met or failed to meet the desired outcomes.
It is not uncommon to have multiple stakeholders for a given business intelligence project, and even stakeholders that span multiple business domains. For example, sales and marketing often share similar interests and desire answers to similar questions. Start by identifying the business domains as stakeholders for the business intelligence project and then identify the specific individuals within those business domains that can provide the goals and requirements for the project.
In most corporate environments, it is often advantageous to identify a single individual as a special kind of stakeholder, a project sponsor. Project sponsors help secure the funding and/or prioritization of resources for the business intelligence project.
Goals
Quite simply, goals or objectives are the purpose of the business intelligence project
or the questions the business is trying to answer. As you can imagine, these goals can be quite varied. Sales may be attempting to analyze overall sales and compare those sales with their plan. Marketing may wish to understand and compare the effectiveness of different marketing campaigns or the effectiveness of different customer trigger events on a corporate website. Production may wish to plan raw material levels more efficiently in order to avoid running out of stock.
The goal or goals of the business intelligence project should be clearly stated and written down in one or two easily understood sentences (minimal business or technical jargon). The goal or goals should be ever-present in the minds of those implementing the business intelligence project in order to guide the project toward success and avoid increasing the scope of the project unnecessarily or, even worse, failing to fulfill the intended goals.
Goals help determine what data will be required in order to fulfill the purpose of the business intelligence project. For example, in the case of the sales goal stated previously, this helps identify that all corporate sales transactions, as well as online and reseller sales transactions, are required as well as the yearly sales budget. For the marketing scenario, this means that marketing campaign dates, click-through rates, and website data are required. Finally, for the production scenario, the goal statement clearly indicates that both production and inventory data will be necessary.
Requirements
As with goals, requirements can come in all shapes and sizes. However, there are particular requirements that should be collected by all business intelligence projects. These requirements include the following:
-
Who will be accessing the reports and dashboards?
This can be defined in terms of individuals or groups/roles such as sales managers, sales people, marketing, and production managers. Defining who will be accessing the reports and dashboards helps determine the required security as well as how reports and dashboards are distributed or shared.
-
Approximately how many individuals will need to access the reports and dashboards?
If groups or roles are used to define who will be accessing a report, it is important to understand how many individuals will be accessing the reports, as this helps identify the licensing mechanism, licensing costs, and the overall scale required in terms of system resources. For example, if hundreds of individuals require the
ability to view the reports and dashboards, this might mean that Power BI Premium licensing is preferred over Power BI Pro licensing or that a Power BI Premium P1 instance needs to be upgraded to a P2 instance.
-
How frequently will users be checking the reports and dashboards?
As with the previous bullet, the frequency with which users will access the report can help determine the scale required in terms of system resources.
-
Should some individuals or groups only see a subset of the data, reports, and dashboards?
This requirement dictates whether specific security features of Power BI, called Row-Level Security (RLS) or Object-Level Security (OLS), are required to secure certain data from some individuals or groups. RLS secures individual rows within tables in the data model while OLS is used to secure columns within tables or even entire tables in the data model. The scenario for this book includes the implementation of RLS.
-
Are there any regulatory concerns regarding the data, such as PCI, HIPAA, or GDPR?
Understanding the sensitivity of the data being accessed is advisable in order to avoid any regulatory pitfalls. In general, dealing with sensitive or regulated data will add time and complexity to the business intelligence project.
-
What is the lowest level of data granularity required, such as individual transactions/ orders/records/lines or aggregated hourly, daily, weekly, monthly, or yearly?
It is important to understand the required data granularity as the more granular the data, the larger the data model. Data granularity in this context refers to the
detail required of the main data or facts being analyzed. For example, consider sales information that consists of a sales order that may contain multiple individual sales lines for specific products. Is it important that the detailed sales lines are preserved and accessible in the data model or is simply the sales amount of the entire sales order required? If the specific products sold in the sales order are necessary, can this data be aggregated by day, week, or month?
-
How will the data be analyzed, such as by date, customer, department, account, country, region, territory, city, or ZIP code?
This requirement identifies the facets or dimensions across which the fact tables will be analyzed. This also helps to identify the granularity of data required. In the example from the previous bullet where product sales can be aggregated daily, if the requirement is to analyze that data by ZIP code, then the granularity of the fact data is increased from simply by product by day to by product by ZIP code by day.
-
How much historical data is required – days, weeks, months, or years?
More historical data increases the overall size of the data model. There are limitations to the size of Power BI data models using Import mode and thus extremely large datasets may require the use of a Power BI technology called DirectQuery. Import models ingest data from the source systems into the Power BI data model and
must be periodically refreshed. DirectQuery models produce report visualizations by querying the source data system directly in real time when the visualizations are displayed. It is not important that you fully understand these technologies now. The scenario for this book focuses on building an Import mode data model and additional information about both Import and DirectQuery storage modes is included within this chapter under the heading Designing a data model.
-
How current must the data be, such as real-time, near real-time, daily, weekly, or monthly?
This requirement helps determine the deployment model for the Power BI data model. Real-time data requirements mean that Power BI technologies such as DirectQuery will be required, while non-real-time data means that Import data models can be considered.
-
What are the core Key Performance Indicators (KPIs) or business metrics required and what are their definitions?
Identifying the KPIs or metrics used by the business and the definition of those KPIs assists in determining the required data as well as the potential required calculations. Some KPIs may be straightforward, such as defining total sales as the number of units sold multiplied by the unit price. Other KPIs, such as Mean Time Between Failure (MTBF), are more complex. Many KPIs have near-universal definitions, such as gross margin percentage being defined as follows:
(𝑝𝑝𝑝𝑝𝑝𝑝𝑝𝑝𝑝𝑝 − 𝑝𝑝𝑐𝑐𝑐𝑐𝑐𝑐)
 𝑝𝑝𝑝𝑝𝑝𝑝𝑝𝑝𝑝𝑝
However, some businesses have their own more obscure or unique KPIs or may
have slight variations to common KPIs.
-
What calendar is used by the business?
Nearly all Power BI data models include some kind of calendar or date table or the requirement to analyze data based upon dates. It is vitally important to understand the calendar used by the business. Many businesses use a calendar based upon
the standard Gregorian calendar year. However, many businesses also use
a fiscal calendar that does not conform to a standard calendar year. Businesses may define their fiscal year to run from July to June, instead of from January to December. Businesses may also use fiscal calendars that define their own months and quarters/periods in order to ensure that each quarter or period contains the same number of days.
Procuring the required resources
Power BI projects require a number of different skill sets and areas of expertise. These skills sets can be broken down into the following roles that must be fulfilled in order to successfully execute a Power BI project:
- Data modeler(s)
- Report author(s)
- Administrator(s)
In smaller organizations, all of these roles may be fulfilled by the same individual, while in larger organizations, or for more complex projects, each role is fulfilled by one or more different individuals. In addition, these roles can be filled either by technical IT resources or business resources. In the past, all of these roles would traditionally be filled by IT technical resources. However, Power BI lends itself to self-service business intelligence that allows business resources to fulfill these roles. It is not uncommon to have technical IT resources fulfill the data modeler and administrator roles while business users fulfill the report author role.
Data modelers
As previously explained, Power BI projects require connecting to source data systems via queries that load data into structured data tables. These structured data tables and their relationships are called a dataset and it is the job of the data modeler to build these
datasets. Data modelers are responsible for creating the queries that connect to the source data systems. In addition, data modelers transform or shape the data as necessary and define the relationships between the tables within the dataset. Data modelers are also responsible for defining the data types within the model (setting columns within data tables to be text or numbers), setting default summarizations such as sum, average, first, and last, and specifying data categories such as country, ZIP code, latitude, longitude, and web URL. Finally, data modelers often create any necessary calculations such as Year-To-Date (YTD) sales or gross margin percentage.
Queries and datasets are key components of Power BI solutions. Well-designed queries and datasets are critical to the success of Power BI projects as improperly designed queries and datasets will lead to a poor user experience, complex calculations, and unnecessary consumption of system resources.
Key skills for data modelers include a robust knowledge of Power Query (and the associated M coding language), the DAX programming language, and data modeling best practices. In addition, knowledge of source data technologies such as SQL, OData, JSON, and XML is often helpful.
Report authors
Report authors are responsible for data analysis and the creation of visuals that comprise reports and dashboards. Generally, report authors serve as business analysts, gathering reporting requirements and understanding the KPIs and metrics desired by the business as well as how the business wishes to analyze and visualize the data to answer important business questions.
Since the reports and dashboards created by report authors are the most visible product of a Power BI project to the business, it is important that report authors have solid skills in visualization and design best practices. Visualization choices, color choices, font choices, symmetry, and the layout of reports are key aspects of building a good user experience.
In addition to visualization and design skills, report authors should be familiar with the use of as many features and capabilities of Power BI reports as possible, including the use of visual interactions, drillthrough, drilldown, bookmarks, buttons, conditional formatting, and mobile layouts.
Administrators
Administrators are a special role within a Power BI tenant, the Power BI administrator role. Users assigned to this role can access the admin portal within the Power BI service. The admin portal allows administrators to monitor the usage of the Power BI service,
as well as enforcing organizational governance policies through the tenant settings. For example, administrators can use the tenant settings to enable or disable certain functionality, such as the use of public embedded codes for reports, the use of R and
Python visuals, the exporting of reports, and the creation of workspaces. Administrators are also responsible for setting up enterprise data gateways that facilitate data refresh for datasets, as well as creating and assigning permissions for data connections used by these data gateways. Finally, administrators can restrict the use of custom visuals and configure capacity settings used by Power BI Premium instances.
Administrators are generally not heavily involved in Power BI projects, but their assistance may be required depending upon the particular needs of individual projects. For example, certain types of projects may require enabling or disabling certain Power BI service tenant settings or the creation of data source connections on enterprise data gateways.
Administrators should have in-depth knowledge of the Power BI service with respect to available tenant settings and security. In addition, administrators should be knowledgeable regarding the creation and configuration of enterprise data gateways. Finally, administrators should understand organizational policies and governance guidelines as related to data access and security.
Discovering the required data sources
Once the base requirements are gathered and resources procured, the next step is to determine the required data sources that will comprise the dataset. Data modelers and report authors will need to collaborate with both IT and the business to discover the required source data repositories. These source data repositories may be transactional systems such as Enterprise Resource Planning (ERP) systems, Customer Relationship Management (CRM) systems, data warehouses, or even individual files maintained by the business, such as in Excel spreadsheets.
An important aspect of this step is ensuring that the required data sources are configured in such a way as to support access and/or data refresh within Power BI. The Power BI reports generated will eventually be published to the cloud in the Power BI service or to an on-premises Power BI Report server. The service or server must be able to access these data sources. Thus, for example, an Excel file stored locally on someone’s desktop would not facilitate access and would need to be moved to a shared network file storage location or similar technology. For transactional systems and data warehouses, it is likely that
IT will need to provide login and access credentials for the source systems and want to understand the potential impact with regard to system processing load on source systems.
Designing a data model
With base requirements gathered, resources procured, and data access granted, it may be tempting to dive right in and start creating datasets and reports. While Power BI lends itself to an iterative, agile style of development, it is always better to spend some time on upfront design work. A good design approach can help identify potential issues and gaps, confirm feasibility, and set realistic expectations regarding what can and cannot be accomplished.
A data model design includes the following steps:
- Identifying facts and dimensions
- Creating a bus matrix
- Determining a dataset storage mode
Identifying facts and dimensions
Data modelers tend to think in terms of facts and dimensions. Fact tables, or facts, are the tables that contain numeric information about particular business processes such as sales, marketing, production, and inventory. Each row in a fact table represents a particular event associated with that business process, such as a change in inventory or a sale to
a customer. Columns in the fact table include such things as the amount of inventory change, the number of units sold, and the unit sale price.
Dimension tables, or dimensions, contain information about people, places, or things involved in the business process. As opposed to storing event information, dimensions store detailed information about people, places, and things. For example, a store dimension table would contain a row for every store in the organization and would include columns such as latitude, longitude, address, country, the date the store opened, and other detailed information that describes each store. Similarly, a product dimension table would include a row for every product sold and might include such columns as color, size, and category.
In a simple scenario of a corporate sales team wishing to compare sales to their planned budget, the fact tables involved would be a sales table and a budget table. Dimensions would include tables for date, customer, product, and territory.
Creating a bus matrix
A bus matrix is a data warehouse planning tool created by Ralph Kimball. It is useful for visualizing the relationships between facts and dimensions. In the simple scenario cited previously of a sales team wanting to compare sales to a planned budget, the bus matrix would look like the following:
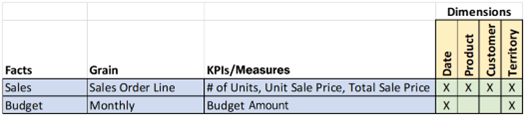
Figure 2.1 – Example bus matrix
As shown in Figure 2.1, the fact tables representing the business processes are on the left and columns describing the grain and important KPIs/measures are included as additional information. The dimension tables describing the people, places, and things
associated with the facts are on the right. The Xs indicate which dimensions are associated with the different facts.
The bus matrix provides an organized overview of the most important elements comprising the data model and is simple to understand and easily referenced. From the bus matrix, we can quickly understand the granularity of the fact tables, the KPIs and measures most important to those fact tables, and which dimensions are related to which fact tables. For example, it is clear from the bus matrix that the budget fact table has
a monthly grain and is broken down by sales territory but not by product.
Determining a dataset storage mode
Deciding on dataset storage is an important design decision that should be addressed early in the planning process. Power BI supports the following three dataset storage modes:
- Import
- DirectQuery
- Composite
Power BI’s default data storage mode is Import. This means that all of the data from source data systems is ingested into a local dataset to the Power BI Desktop file. Import mode allows the full functionality of all DAX functions and supports the extension of the dataset with DAX calculated columns as well as fast performance for DAX measures. Because of the columnar compression technology used with Import mode datasets, tens of millions of rows can be imported while still maintaining acceptable performance for complex calculations. In addition, Import mode datasets allow you to combine multiple different data sources into a single dataset. However, there are certain disadvantages to Import mode data models. One disadvantage is the limit to dataset sizes. Users using
a Pro license can publish datasets to the service that are up to 1 GB in size, while Premium licensing allows initial dataset sizes up to 10 GB in size to be published to the service.
Another consideration for Import mode data models is that the data will need to be refreshed from the source systems. Pro users can schedule up to 8 refreshes per day in the service, while Premium users can schedule up to 48 refreshes per day.
DirectQuery mode datasets do not ingest any data into the local dataset. This avoids the dataset size limitations and refresh requirements associated with Import mode datasets. However, this approach means that when reports are displayed, network traffic and source system processing load is generated as information is retrieved from the source data systems. In addition, there are additional restrictions and limitations with DirectQuery mode datasets, including the following:
-
DirectQuery mode only allows a single source system to be accessed as part of the data model. While multiple tables within a single source system can be used in the model, you cannot use tables from different source systems.
- DAX calculated columns are not supported for DirectQuery mode models.
- Certain DAX functions are not supported or optimized for role-level security or DirectQuery performance.
- Many Power Query M functions cannot be used with DirectQuery to transform or shape data.
Composite models allow you to mix DirectQuery and Import sources, or even multiple DirectQuery sources. While more complex, when configured correctly, composite models can combine the ability to retrieve near real-time data from DirectQuery sources with the high query performance of Import models. When using composite models, the storage mode for each table can be specified within the model.
Planning reports and dashboards
As mentioned previously, Power BI lends itself to an agile, iterative development process where feedback from stakeholders is collected on a regular basis and used to inform
and adjust the development process. This is especially true when authoring reports and dashboards. That said, it is still useful to include some upfront design work for reports. This often takes the form of one or more whiteboarding sessions with key stakeholders where different layouts for reports are discussed and mock-ups or wireframes of report pages are created. The goal of these design sessions is to understand the key KPIs and metrics the business wants to be displayed on reports, understand whether there will be multiple report pages, and discuss potential interactivity between visual elements and features in the report, such as the use of slicers, drillthrough, and drilldown.
That covers all five elements of planning your Power BI project. Next, we will put this planning knowledge to use in defining an example use case that we’ll be using throughout the rest of the book.
Explaining the example scenario
The following chapters of this book primarily focus on a single, real-world scenario. This section introduces the scenario and implements the planning process introduced in this chapter for the example scenario.
Background
The organization at the heart of this scenario is a regional professional services firm with offices located in Charlotte, Nashville, and Cleveland providing professional services related to technology, accounting, and management consulting. This firm recently conducted a yearly employee survey that highlighted a strong employee demand for increased flexibility regarding Personal Time Off (PTO). As a result, human resources have decided to implement unlimited PTO. While time off still needs to be approved, employees no longer have a set amount of days of PTO per year. This is an enormous benefit to employees but, in order to stay profitable, it is now imperative that the organization is able to closely track and report on utilization so that managers can make informed business decisions around requests for time off.
In this scenario, you will take on the persona of Pam, who works in finance at the firm and has access to all of the division budgets as well as the daily time reports from employees.
As such, it has fallen to Pam—you—to implement better utilization reporting and distribute that information throughout the firm.
Identifying stakeholders, goals, and requirements
Since the subject of the business intelligence project revolves around the utilization of consultants, the business domain falls into the delivery organization as opposed to sales or marketing. As part of the project planning process, Pam has identified the following stakeholders:
- Partners and executive management
- Branch managers (Charlotte, Nashville, Cleveland)
- Division managers (technology, accounting, management)
Pam has identified Mike, her boss and Chief Financial Officer (CFO), as the project sponsor. In conversations with Mike, Pam formulated the following project goal statement:
Report and analyze % utilization by employee, branch, and division across any date range, including the ability to identify trends and forecasts. The ability to compare revenue against budgets is desirable but not an absolute requirement at this time.
Finally, Pam collected the following requirements from Mike and the other stakeholders:
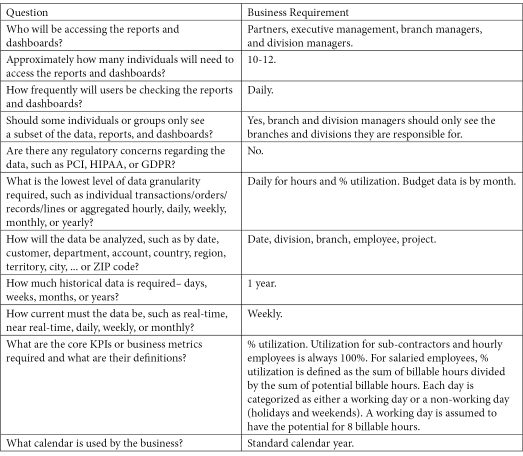
Figure 2.2 – Questions and answers regarding business intelligence
With this information gathered, Pam must next acquire the necessary resources to fulfill the company’s needs.
Procuring the required resources
As this is a relatively small business intelligence project and the firm only has approximately 450 active employees across all employee types, it has fallen to Pam to be both the data modeler and report author for the % utilization project. Pam will work with Nathan in the IT division, who is the Power BI administrator for the firm.
Discovering the required data sources
Pam knows that all of the firm’s employees and reported hours are contained within the firm’s Dynamics 365 Business Central tenant. In addition, Pam maintains an Excel spreadsheet on a network file share that holds budget information for all branches and divisions by month.
Designing a data model
Pam has identified the following facts for the data model:
- Hours: Contains reported hours for every employee by day
-
Budget: Contains a forecasted budget by month for each division and branch Pam has also identified the following dimensions for her model:
- Date
- Branch
- Division
- Employee
- Project
The following bus matrix was created to represent the design of the data model:
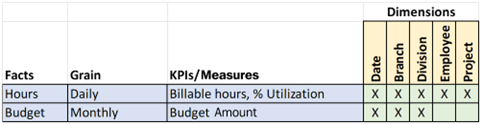
Figure 2.3 – Bus matrix for the example scenario
After reviewing the requirements, Pam has decided to use an Import data model. Th s decision was based upon the requirement that the report data be kept up to date on a weekly basis. Employees report hours at the end of every week. With approximately 450 employees and a daily grain on the Hours fact table, Pam estimates that a year’s worth of data will only be about 160,000 rows of data. In addition, Dynamics 365 Business Central does not support DirectQuery. Finally, Pam needs to combine two different sources of data – the hours information coming from Dynamics 365 Business Central, and the budget information stored in an Excel spreadsheet. All of these reasons make Import mode a good choice.
Planning reports and dashboards
Pam holds design sessions with each of the stakeholder groups. All groups agree that report pages should be kept concise and clean with no more than four or five visuals on a page. The stakeholder groups also agree that there should be simple filtering of the
reports by date range, branch, division, and employee type. Mike suggests that the reports also include the ability for users to dynamically set the target utilization as different branches and divisions have slightly different utilization targets.
Partners and executive management desire an executive summary page that includes the
% utilization for the entire calendar year as well as a visual that displays the % utilization trend by month. Finally, partners and executive management also desire that the % utilization be displayed across branches and divisions.
Division managers want similar information but displayed somewhat differently. Division managers are also interested in the % utilization for the year and % utilization broken down by branch. However, division managers also want visuals that display the total hours and % utilization by project code as well as employee type. Finally, division managers desire the ability to quickly see the total hours broken down by categories such as billable time, PTO, project non-billable time, bench time, and sales support.
Branch managers desire extremely similar information to division managers, with the main difference being that branch managers want to see hours and % utilization by employee rather than by project code.
Finally, all stakeholders feel that it is important to be able to drill down into additional detail pages that display hours and utilization per employee and per project code in order to analyze and determine the cause of utilization issues.
Summary
In this chapter, we introduced the planning process for Power BI business intelligence projects. Upfront requirements such as gathering, planning, and design are critical steps in ensuring the success of any business intelligence project, and projects involving Power
BI are no exception. We then introduced the specific scenario that will be used throughout the rest of this book. As Pam, you have been tasked with creating a data model and report that will assist a regional consulting firm in visualizing and analyzing the % utilization of employees across divisions, branches, and projects.
In the next chapter, we will install Power BI Desktop, explore its interface, and familiarize ourselves with some of its functionality.
Questions
As an activity, try to answer the following questions on your own:
- A project stakeholder that helps procure funding and prioritize resources is called what?
- What are the three roles required for Power BI projects?
- What is the difference between facts and dimensions?
- What visual tool is used to design and organize a data model?
- What are the three dataset modes that Power BI supports?
Further reading
To learn more about the topics that were covered in this chapter, please take a look at the following references:
- Implementing different calendars in reporting: https://www.sqlshack. com/implementing-different-calendars-in-reporting/
- The matrix: https://www.kimballgroup.com/1999/12/the-matrix/
- The matrix: revisited: https://www.kimballgroup.com/2005/12/ the-matrix-revisited/
- Dataset modes in the Power BI service: https://docs.microsoft. com/en-us/power-bi/connect-data/service-dataset-modes-
understand-
Manage data storage in Power BI workspaces: https://docs.microsoft. com/en-us/power-bi/admin/service-admin-manage-your-data-
storage-in-power-bi
-